

What $100 of AI Capex Buys, and How Long It Lasts
Using BNP Paribas's capex breakdown, I trace chip, network, power, cooling, and facility costs—and why replacement cycles vary by supplier.
BusinessBeyond AI Chips, What Equipment and Facilities Does This Actually Take
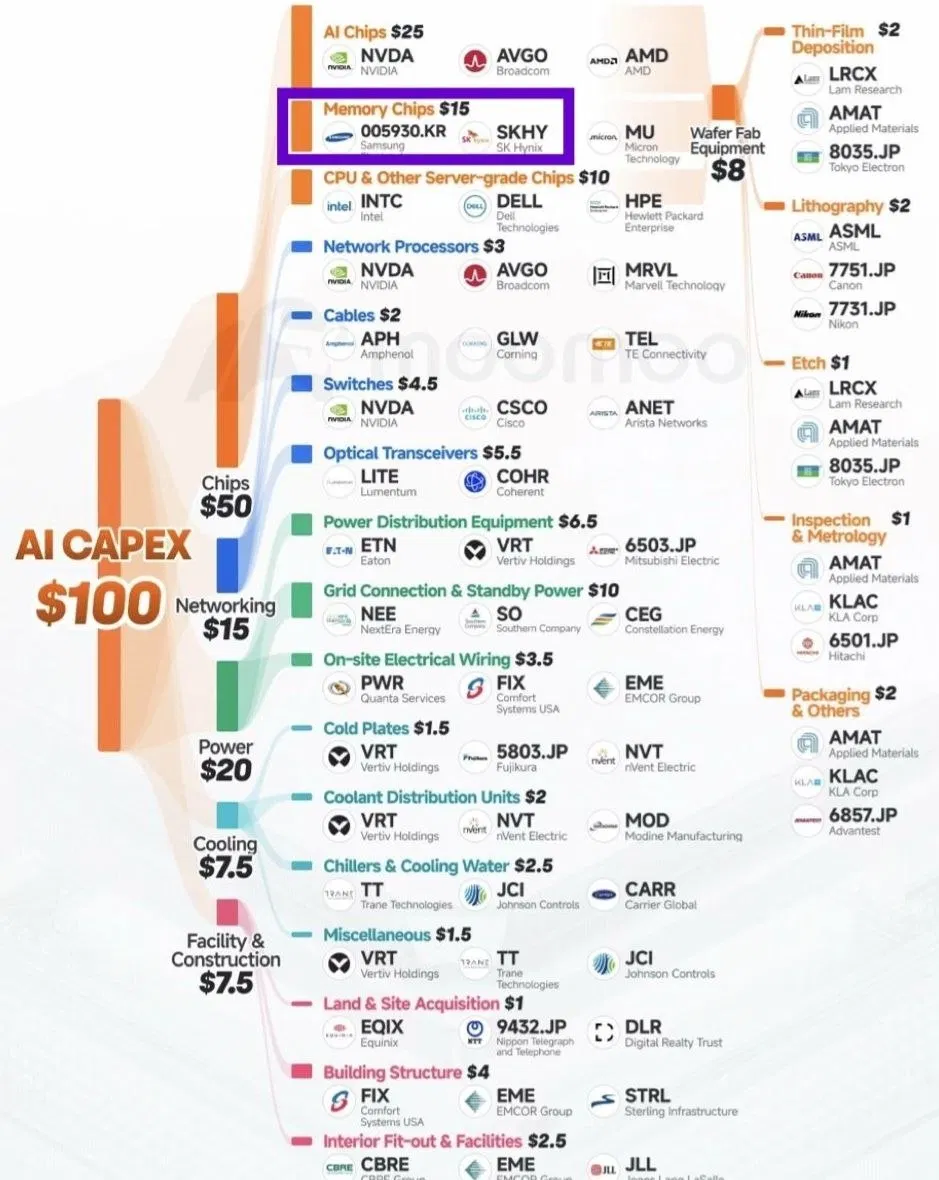
A single Sankey diagram1 mapping where every $100 of AI capex flows made the rounds in investment circles this week. On the left sits a bold bar labeled AI CAPEX $100, and as it branches rightward it eventually fans out into more than 60 company logos. The first branch grabs your attention: $50 to chips, $25 of that to AI chips specifically. Nvidia, Broadcom, and AMD logos sit side by side.
In this issue, I want to look at the cost of each category in this chart, and also at how long each piece of equipment stays in service. Servers and networking gear get replaced relatively often, while buildings and power infrastructure last much longer. Even within the same AI capex bucket, the order cycles and risks facing the companies that supply this equipment can differ widely. Still, we need to separate how accounting spreads a cost over time from when the equipment is actually replaced.
The Chart Splits Capex Into Five Categories
First, let’s fix the sourcing. The version circulating on social media carries a watermark from the trading app moomoo, but the original estimate comes from a model built by BNP Paribas’s equity research team. And let’s be precise about what this chart does and doesn’t say. What it says is the allocation by category: chips 50, power 20, networking 15, cooling 7.5, facilities 7.5. What it doesn’t say is how much goes to any individual company. The logos in each box are representative examples for that category—they don’t indicate how much money goes to that specific company. Vertiv’s logo shows up in four boxes, but this data alone tells you nothing about what share of the $100 Vertiv actually captures. Cross that line and you get sentences like “Samsung Electronics captures 7.5% of AI capex”—which is a misreading.
Let’s look at the full breakdown in table form first, then walk through what equipment and companies sit inside each category.
| Category | Amount | Sub-branches | Representative companies (per chart) |
|---|---|---|---|
| Chips | $50 | AI chips 25 · Memory 15 · Server CPUs and other 10 | Nvidia, Broadcom, AMD / Samsung Electronics, SK hynix, Micron / Intel, Dell, HPE |
| Networking | $15 | Network processors 3 · Cables 2 · Switches 4.5 · Optical transceivers 5.5 | Marvell, Amphenol, Corning, Cisco, Arista, Lumentum, Coherent |
| Power | $20 | Power distribution equipment 6.5 · Grid interconnection and backup power 10 · On-site electrical work 3.5 | Eaton, Vertiv, Mitsubishi Electric, NextEra, Southern Company, Constellation, Quanta Services |
| Cooling | $7.5 | Cold plates 1.5 · Coolant distribution units 2 · Chillers and coolant 2.5 · Other 1.5 | Vertiv, Fujikura, nVent, Modine, Trane, Johnson Controls, Carrier |
| Facilities | $7.5 | Land 1 · Building structure 4 · Interior fit-out 2.5 | Equinix, NTT, Digital Realty, Comfort Systems, EMCOR, CBRE, JLL |
Chips, $50: Three Kinds of Semiconductors and the $8 Hidden Behind Them
The $50 for chips splits three ways. AI chips at $25 are the accelerators—the GPUs and custom chips (ASICs) that actually do the training and inference. Even within this $25, the structure is shifting. Broadcom’s logo sits next to Nvidia’s GPU because Broadcom designs and supplies custom chips like Google’s TPU. Amazon’s Trainium and Meta’s MTIA fit the same pattern. For hyperscalers, the surest way to shrink Nvidia’s cut of the $25 is to build their own chips, so a quiet migration keeps happening within this branch.
Memory at $15 covers HBM2 and server DRAM. These are the components that sit next to the accelerator and pump in data, and two Korean companies are here. It matters that memory is drawn as a separate branch from AI chips in the chart. HBM is physically packaged into the GPU itself—Nvidia buys it, assembles it, and sells the whole package. So on a hyperscaler’s invoice, the HBM cost is buried inside the GPU line item. BNP pulled it back out and drew it as its own branch, tracing where the money actually ends up.
Server CPUs and other chips at $10 cover the general-purpose processors and finished servers needed to run a GPU server. In Issue 217 I wrote that agents think with the GPU and work with the CPU—that CPU is here. Intel and AMD’s server CPUs, along with server integrators like Dell and HPE, all fall into this category.
There’s one more $8 branch peeling off sideways from the chip category: wafer fab equipment. Deposition 2, lithography 2, etching 1, inspection and metrology 1, packaging 2. This isn’t money hyperscalers spend directly—it represents secondary spending, where money chip companies receive flows back out into factory equipment. That’s why it’s drawn separately from the $100. ASML, Lam Research, Applied Materials, and Tokyo Electron supply this equipment. Here too you see a difference in service life. Assume a GPU lasts about 5 years—a fab can keep a lithography machine running for more than 20 years. In Issue 54 I wrote that even with the blueprints, you couldn’t build ASML’s machines. That equipment sits inside the $8 branching off from chips, and it’s among the longest-lived equipment connected to this capex chart.
A Deep Dive into Semiconductors—You’ll Be Thinking About This All Night · Issue 54 · INLEVEL9Even with $165 billion invested, can the US replace Taiwan? I traced everything from wafers to assembly.Networking, $15: Where Copper Gives Way to Light
The $15 for networking is the cost of binding tens of thousands of GPUs into something that acts like a single computer. AI training isn’t the work of one GPU. Thousands, tens of thousands of GPUs have to constantly exchange computation results, and if that exchange is slow, even the most expensive GPU sits idle. That’s why networking isn’t a GPU accessory—it’s a variable that determines GPU performance. In Korea this field is usually just called optical communications.
The biggest branch here is optical transceivers3 at $5.5. These convert data traveling between server racks into light. Within a single rack, copper wiring is still used. One reason Nvidia’s GB200 NVL72 crams 72 GPUs into one rack is to pack as many GPUs as possible within the distance copper can handle. But once you step outside the rack, copper can’t deliver the distance and speed needed. That’s the point where the electrical signal has to become light, and the transceiver is that converter. Every time a new GPU generation raises processing speed, transceivers move to the next spec too. So this branch grows alongside every GPU sold, and gets replaced whenever the GPU does. Lumentum and Coherent supply this component, and Nvidia’s 2025 announcement of co-packaged optics (CPO)—mounting optical components directly next to the chip—is a move to pull that $5.5 toward itself.
Switches at $4.5 are the equipment that directs traffic between light and electricity. Cisco and Arista are the traditional leaders here, but it’s notable that Nvidia’s logo also appears in the switch box. Nvidia is no longer a company that just sells GPUs—it sells GPUs, switches, and cables as a bundled set. Network processors at $3 are the chips inside those switches, split between Marvell and Broadcom. Cables and connectors at $2 go to companies like Amphenol and Corning. Unglamorous parts, but a single AI data center can lay down thousands of kilometers of optical cable.
Power, $20: Not the Electricity Bill, But the Equipment to Deliver It
Power at $20 is the second-largest branch in this chart. It’s bigger than cooling and facilities combined at $15, and bigger than networking’s $15 as well. But this $20 isn’t the electricity bill. Electricity bills are operating expenses, so they don’t appear in a capex chart. This $20 is the cost of the physical equipment needed to receive power and deliver it all the way to the chip.
Half of it—$10—goes to grid interconnection and backup power: substations, transmission lines, and on-site generation equipment like gas turbines or fuel cells that produce electricity the grid can’t supply. The scale explains why this branch grew so large. A single 1GW data center matches the output of one nuclear reactor. Connecting a facility like that to the US grid can take years just for interconnection review, which is why hyperscalers have started buying or building power plants directly. That’s why power companies like NextEra, Southern Company, and Constellation show up in the chart. In Issue 189 I told the story of Google choosing a reactor design that had never been built before—that contract sits inside this $10. In Issue 141 I wrote that ordering a single transformer takes 5 years—that transformer is here too. Gas turbines are booked so far out that reports say GE, Siemens, and Mitsubishi Power’s combined production capacity is sold through 2030.
It’s Not Money or Chips That’s Stalling Data Centers · Issue 141 · INLEVEL9Not money, not chips—power is what’s stalling AI data centers.Power distribution equipment at $6.5 is what steps down and splits high-voltage electricity coming into the building into voltages that can actually be plugged into a rack. Eaton, Vertiv, and Mitsubishi Electric supply this kind of equipment. Vertiv started as an uninterruptible power supply (UPS) company, but it shows up in four boxes in this chart—it’s one of the few companies that sells both power distribution and cooling. On-site electrical work at $3.5 is the labor and construction cost of actually installing and wiring that equipment. Names like Quanta Services, Comfort Systems, and EMCOR may sound unfamiliar, but as AI data centers multiply across the US, electrical technicians are becoming the scarcest resource of all.
Cooling, $7.5: Where Air Gives Way to Water
Cooling’s $7.5 is small in dollar terms, but its structure is changing fast. Older data centers ran 10–15kW per rack and cooled it with air. Today’s AI racks run 60–120kW. A single GB200 NVL72 rack sits around 120kW, and that heat can’t be removed with air. So a metal plate is placed on the chip and water is run across it.
The first two of the four items — the $1.50 cold plate and the $2 coolant distribution unit (CDU)4 — are that plumbing. The cold plate is the metal plate that touches the chip directly, and the CDU is the pump assembly that sends coolant out to the cold plates across multiple racks and recovers the heated water. These parts are installed with the rack and replaced with the rack. When a new GPU generation shifts where and how much heat is generated, the cold plate has to be redesigned too. Fujikura, nVent, and Modine sit in this category.
The latter two items — the $2.50 chillers and cooling towers, and the $1.50 in miscellaneous gear — are building infrastructure. This is the equipment that pushes the hot water recovered by the CDU outside the building to cool it, and it belongs to HVAC firms like Trane, Johnson Controls, and Carrier. Once built, this stuff runs for a long time. Even within the single category of “cooling,” you find parts that get replaced roughly every 5 years along with the rack, mixed together with infrastructure installed into the building that lasts about 20 years. According to the construction-cost index cited by the Epoch model, liquid-cooling designs raise construction costs by 7–10% compared to air cooling. I’ll come back to this point shortly, in the lifespan table.
$7.50 in facilities: site, building, and interior systems
The $7.50 facilities category is the smallest — $1 for the site, $4 for the building, $2.50 for interior systems. When people think “data center,” a massive building comes to mind first, but in dollar terms, the building is less than a tenth of what goes inside it. This is the point of sharpest departure from data centers of the past. Back when the business model was leasing floor space for a handful of servers, the building was the center of cost. Now the building has been demoted to a box that holds expensive chips.
The $1 site cost looks small, but regional variation is enormous. Loudoun County, Virginia, or Santa Clara, California, run $2.5M–$4.5M per acre, while Ohio or Indiana run $100K–$300K per acre — a 15x gap. That’s why hyperscalers are steering away from expensive land toward the Midwest, and in that process they sometimes run into landowners who turn down offers of ₩39 billion (~$28M), as I covered last month in the piece on Monyeo Lake, Kentucky. The $4 building cost covers the floor and walls built to bear server weight; the $2.50 in interior systems covers finishing work like fire suppression, security, and under-floor wiring. This category is where Equinix and Digital Realty (data-center leasing firms) and CBRE and JLL (real-estate firms) show up.
The building and interior systems can outlast the servers. But the 15-to-30-year window can’t be applied to the land in the same way, because land doesn’t depreciate the way buildings or servers do.
Converting this $100 into real dollar figures gives you a sense of scale. Combine the 2026 capex guidance from Amazon, Microsoft, Alphabet, and Meta, and you get roughly $725 billion — up 77% from about $410 billion in 2025, and Alphabet raised its own ceiling to $205 billion at its Q2 earnings call. Not all of that capex is AI, but most of it flows into AI data centers. If you apply the chart’s ratios directly to this $725 billion, you get roughly $180 billion for the AI chip box, roughly $109 billion for the memory box, and roughly $145 billion for the power box. These are derived figures — the BNP ratios simply multiplied against the combined total of the four companies — so treat them as a sense of scale, not a precise allocation.
Depending on how you classify things, power costs end up buried in a different line item
BNP’s chart lists power costs separately, at $20. Other institutions’ models sometimes fold power infrastructure costs into the “facilities” line instead. When comparing two sources, you need to check not just what the line items are called, but what equipment is actually included under each one.
Epoch AI modeled the cost structure of a 1GW-scale AI data center in May 2026. The assumptions: a US hyperscaler owns the facility outright, and every server is an Nvidia GB200 NVL72. Upfront capital expenditure comes out to $37.9 billion, broken down as follows: servers at $21.2 billion (56%), facilities at $11.4 billion (30%), networking equipment at $4.9 billion (13%), land at $170 million, and substation equipment at $160 million.
Placed side by side with BNP’s chart, three things become visible.
| Item | BNP Paribas (per $100) | Epoch AI (per $37.9B) |
|---|---|---|
| Chips/servers | 50 | 56 |
| Networking | 15 | 13 |
| Power | 20 | Included in facilities |
| Cooling | 7.5 | Included in facilities |
| Building/site | 7.5 | 30 (includes power & cooling), plus ~1 for land/substation |
First, the shares for chips/servers and networking are similar across both sources — 50 vs. 56, 15 vs. 13 — meaning IT equipment accounts for roughly two-thirds of the total in both models. Second, the $35 that BNP splits into power ($20), cooling ($7.5), and facilities ($7.5) is consolidated into a single $30 “facilities” line in Epoch’s model. That’s because Epoch uses a construction cost index that bundles a building’s electrical and mechanical systems into construction costs. Third, substation equipment comes to a mere 0.4% in Epoch’s model because it assumes grid power only and includes no on-site generation at all. The grid-connection-and-backup-power branch that BNP prices at $10 is essentially absent from Epoch’s breakdown.
None of this means either source is wrong. In Issue 181, I wrote that the $800 billion market-size figure swings in both directions depending on how it’s defined — the same thing is happening here with cost structure charts. The absence of a separate power line item doesn’t mean power costs are $0. It’s a difference in classification method and in assumptions like whether on-site generation is included. So if you’re going to cite this chart and say “power is 20% of AI capex,” you need to attach the label: according to BNP’s classification.
Epoch’s model also shows how asset lifespan affects annual costs. It assumes IT equipment lasts 5 years and facilities last 14 years, and converts upfront capex into an annualized cost that factors in the cost of capital — a different exercise from simple straight-line depreciation, which just divides purchase price by years of use. Under this model, total annual cost of ownership comes to about $8.5 billion, with servers accounting for roughly $5 billion, or 60%. Servers’ share was 56% of upfront capex, but it grows by about 4 percentage points once you look at annual cost.
Accounting Useful Life and Actual Replacement Timing Diverge
You spend on capex all at once, but accounting spreads that cost over the life of the asset instead. This is called depreciation5, and the length of time it’s spread over is called useful life. Here’s what the hyperscalers disclose as server useful life: Microsoft 6 years, Alphabet 6 years, Meta 5.5 years, Amazon 5 years. Starting in January 2025, Amazon shortened the useful life of some servers from 6 years to 5 years, citing faster AI technology cycles that make servers obsolete sooner than before. Meta moved the opposite direction, extending its useful life from 5 years to 5.5 years in 2025. Two companies, looking at the same kind of parts in the same period, went in opposite directions on how long they’d last.
Buildings and electrical equipment tend to last longer than servers. The sources I referenced for this piece put data center buildings at 15 to 30 years, substations and transmission lines at 30-plus years, and power generation equipment at 20 to 40 years. That said, you can’t apply the same timeframe to every piece of equipment. Even Epoch’s model bundled the entire facility together and assumed 14 years. The table below is my own regrouping of BNP’s dollar figures by usage period — it doesn’t represent any actual company’s asset schedule or book balance.
| Category by usage period | Amount | What’s included | Caveats when interpreting |
|---|---|---|---|
| Shorter-lived equipment (assumed 3–6 years) | $65 | AI chips 25 · memory 15 · CPUs and servers 10 · networking 15 | Actual replacement timing may differ from useful life |
| Medium-lived equipment (assumed 5–15 years) | $3.5 | Cold plates 1.5 · CDUs 2 | Depends on rack design and replacement cycle |
| Long-lived equipment and site (equipment assumed 15–40 years) | $31.5 | Grid interconnection and generation 10 · power distribution 6.5 · electrical work 3.5 · chillers 2.5 · other cooling 1.5 · buildings 4 · interior fit-out 2.5 · land 1 | Timeframes differ by equipment type, and land isn’t depreciated |
Splitting the $7.5 of cooling costs into chip-adjacent components versus building infrastructure in this table was my own judgment call. The point of separating $65 of IT equipment from the remaining $35 is to show that usage periods can differ. It doesn’t mean the entire $65 disappears after 5 years, or that the entire $35 survives for a full 30 years. To calculate actual book balances, you’d need to know each item’s acquisition date, depreciation method, and useful life.
The reason I zeroed in on this distinction is that how long equipment stays in service helps explain suppliers’ replacement demand and order cycles.
For the companies supplying the $65 of IT equipment, demand can come not just from new installations but from replacing existing equipment. But setting a GPU’s useful life at 5 years doesn’t mean the same dollar amount necessarily gets spent again every 5 years. Companies might keep using existing equipment longer, or newer equipment might be powerful enough that fewer units do the same job. Shifts in GPU generations and networking standards also ripple into demand for memory and optical transceivers. Revenue for suppliers like Nvidia is shaped by these purchase-and-replace decisions, which makes it hard to explain with total capex spending or growth rates alone.
The $35 allocated to power, cooling, and facilities includes a lot of long-lived equipment. If a substation lasts 30 years, you’re not replacing the same equipment often. That doesn’t mean the supplier gets zero new orders for 30 years, though — new installations and expansions at other sites can still generate orders. For companies like Eaton, Vertiv, and Quanta Services, what matters is when they can deliver on orders received and recognize them as revenue. A backlog shows what’s coming, but it doesn’t rule out cancellations or delays.
We can still make a rough guess at the scale of future replacement. Take the four companies’ roughly $410 billion in 2025 capex and roughly $725 billion in 2026 guidance, multiply by the 65% IT-equipment share, and you get about $740 billion. If you assume everything is used for 5 years, the math points to somewhere around 2030–2031. But this is just an illustrative exercise multiplying ratios and guidance figures from different sources. Not all capex goes toward AI, and actual replacement timing, pricing, and performance can all shift. So $740 billion shouldn’t be read as confirmed replacement demand or a floor for supplier revenue.
It’s also worth comparing how fast a drop in AI demand would show up in orders and revenue. IT equipment purchases can be deferred, while power infrastructure that’s already under construction is a different story. Still, you can’t assign a fixed reaction time — chips next quarter, power 5 years out. It depends on contract terms, construction progress, and production capacity.
Korea Is in the $15 Box — and in the Unlabeled $20 Box, Too
Now let’s look at the chart again, this time from Korea’s perspective. In the chart, the Korean companies that jump out are Samsung Electronics and SK Hynix. Both sit in the $15 memory box. Outside memory, in the remaining $85, no Korean names appear. But since the chart only picked representative logos, this doesn’t mean Korean firms account for just 15% of AI capex.
The $15 in memory belongs to the category of IT equipment with relatively short usable life in the earlier table. When GPU generations and HBM specs change, replacement demand can emerge, but that doesn’t mean orders of the same scale return like clockwork every 5 years. If hyperscalers cut spending or delay replacements, demand and prices can be affected too. This is worth keeping in mind alongside the memory competition covered in Issue 219. Issue 183 covered how SanDisk secured 4-year supply commitments from its customers. I read these long-term contracts as an attempt to make volatile demand more predictable.
But there’s one more Korean name missing from the chart. It’s the $20 power box. HD Hyundai Electric is the No. 1 player in the North American transformer market, and on July 6, 2026, it raised its annual order target 22.8%, from $4.222 billion to $5.185 billion. The reason: North American AI data center investment and demand to replace aging power grids. Its backlog at the end of Q2 stood at $8.49 billion. It’s building its No. 2 plant in Alabama, and once the expansion of its existing plant finishes in April 2027, power transformer production capacity will rise by 50%. Hyosung Heavy Industries has expanded its Memphis, Tennessee plant 3 times, and entered a market once dominated by a handful of players through its high-voltage direct current (HVDC) transmission technology. As of 2025, operating profits at Hyosung Heavy Industries, HD Hyundai Electric, and Iljin Electric rose 122%, 49%, and 90% year-on-year, respectively.
The fact that the BNP chart placed Eaton, Mitsubishi Electric, and NextEra in the power box while leaving out Korean companies is a limitation of the chart. It’s an omission that comes from picking a handful of representative examples, not a sign that no money is flowing there. Korean firms participate not only in the chart’s $15 memory segment but also in the $20 power segment. These figures represent each segment’s overall share, not the revenue share of Korean companies.
Memory and transformers run on different order cycles. For memory, shifts in demand and price can feed through to earnings quickly, whereas transformers take a long time from order to production to delivery. The fact that backlogs run 2-3 years deep, or that expansions take 2 years, illustrates this difference. But the fact that a transformer can last 30 years doesn’t mean a supplier’s next reorder only comes 30 years later. Issue 209 covered data showing that 92% of purchases of the SK Hynix leveraged ETF came from retail investors. Even within AI-related investing, I think memory’s price volatility and power equipment’s order-to-delivery risk need to be examined separately.
If you’ve read this far, the next time you hear the phrase “AI infrastructure beneficiary stock” or “AI-benefiting industry,” you can ask three questions.
- Which box, out of $100, is the company in? Whether it’s the $25 AI chip box, the $5.5 optical transceiver box, or the $1 land box, the market size can differ by a factor of 25.
- How long does the equipment last, and when does it get replaced? You need to separate the accounting useful life from the actual replacement timing, and look at both new orders and replacement demand for suppliers.
- Is the constraint on scaling up orders a supply problem or a demand problem? If delivery takes 5 years, as with transformers, you need to examine production capacity and order backlogs. For GPUs, where supply has expanded, how much customers are actually buying may matter more.
Even when you come across a stock recommendation, it’s worth checking whether there’s evidence to answer these three questions. For the record, this piece is not a recommendation to buy or sell any particular stock or product. Investment decisions and their outcomes are your own responsibility, and the figures cited here reflect values confirmed through disclosures and news reports at a given point in time — they may have changed by now.
Oswarld’s Lens
When I first saw this chart, what caught my attention was which companies the money was flowing to. Looking again, I realized that how long each company’s equipment stays in use matters just as much. If you only look at the investment split by segment, the beneficiary companies all look alike — but factor in replacement cycles and contract terms, and the differences between these businesses become much clearer.
This distinction also helps when thinking through the AI-bubble debate. On the $65 side — IT equipment — delaying purchases of next-generation GPUs or memory orders can hit earnings directly. The substations, transmission lines, and buildings that make up the remaining $35 can physically stick around even if investment slows. We saw something similar in issue 192, on Britain’s railway bubble of the 1840s: the stock price of the railway companies and the ongoing utility of the tracks that remained diverged sharply. That said, the mere fact that facilities survive doesn’t mean the invested capital gets recouped, or that suppliers keep turning a profit.
So when I hear that “AI investment is excessive,” I split the claim in two. For the $65 IT-equipment side, the question is whether companies are buying far more equipment than future compute demand will justify. For the remaining $35, the question is whether the power infrastructure and buildings being built can actually be put to full use — including uses beyond AI. The answers to these two questions can differ. And in my view, if you lump all these businesses together as the same AI-beneficiary industry, it’s easy to miss exactly that difference.
Closing
In this issue, I broke down the $100 of capex in the BNP chart into $50 for chips, $20 for power, $15 for networking, $7.5 for cooling, and $7.5 for facilities. Comparing this with the Epoch model, I confirmed that the same power and cooling costs can end up classified under facilities, depending on how you draw the categories. I then looked at how long equipment and facilities actually stay in service. You can’t simply split the $65 of IT equipment and the remaining $35 into a neat 5-year bucket and a 30-year bucket, but understanding the differences in replacement cycles and ordering patterns still helps you make sense of the business.
Korean companies participate across several of these segments too, including memory and power equipment. Just seeing a company’s logo on the chart isn’t enough to judge its share of the value or its investment merit. Next time you look at an AI infrastructure company, check what it actually supplies, when its customers replace that product, and what has to happen between taking an order and booking revenue from it.
💬 Where does the company you work for, or one you’re interested in, sit on this chart? Drop a comment with the name of the box and how many years you think that box’s asset life runs. Feel free to point out other Korean names that are missing from the chart, too.
📨 If you have a colleague who lumps every AI-related stock together under the single word “beneficiary stocks,” send them this piece.
Looking at this fragment, I’ll check for Hangul characters, number accuracy, and structural matches.
Keep the perspective, not the noise.
We choose one consequential shift and trace what sits beneath it, every other day.
Confirm once to finish subscribing.
Already a subscriber? Sign in to join the conversation


References & Further Reading
Primary sources
- BNP Paribas Equity Research estimates, chart built with SankeyMATIC, “How $100 in AI Infrastructure Spending Breaks Down” (reconstructed by cloudnews.tech), September 3, 2026. Link ··· A write-up laying out the original source of the Sankey diagram covered in this issue and the sector-by-sector figures. The moomoo version is a reprocessing of this same estimate.
- Amelia Michael, Ben Cottier, “Servers account for 60% of the total cost of ownership of a one-gigawatt AI data center”, Epoch AI, May 14, 2026. Link ··· A cost model for a 1GW data center. The breakdown of the $37.9 billion in upfront investment, the annualization method, and the assumptions and limitations are all disclosed in a spreadsheet, making it easy to cross-check against the BNP chart.
- Yahoo Finance, “Meta, Microsoft, Amazon, and Alphabet are about to spend a shocking amount of money to dominate the AI era”, June 3, 2026. Link ··· Covers the four companies’ combined $725 billion in 2026 capital expenditure and Goldman Sachs’s cumulative forecast through 2030.
- Financial News (via Daum), “‘North America’s No. 1 in Transformers’ HD Hyundai Electric Raises This Year’s Order Target by 23%”, July 6, 2026. Link ··· A correction disclosure report on the order target being raised from $4.222 billion to $5.185 billion.
- Hanskyung (via Daum), “HD Hyundai Electric’s Next Growth Engine: ‘Data Centers’”, August 4, 2026. Link ··· Summarizes second-quarter earnings, an order backlog of $8.49 billion, and the risk of overexposure to North America.
- Dailian, “‘We’ll Pay the Tariffs’… Even the U.S. Is Lining Up for HD Hyundai Electric and Hyosung Heavy Industries”. Link ··· Contains a brokerage analysis noting that lead times for ultra-high-voltage transformers have stretched to as long as 5 years.
Background
- Global Data Center Hub, “What a Data Center Actually Costs: CapEx Breakdown and the Drivers That Move It”, September 2026. Link ··· Lays out, from a practitioner’s perspective, the depreciation gap between buildings (15–30 years) and servers (3–5 years) and the structure of construction cost per MW.
- Dealsite, “Hyosung Heavy Industries, HD Hyundai Electric, LS Electric, Iljin Electric 2025 Earnings”. Link ··· The source for the operating-profit growth rates of Korea’s four power-equipment makers in 2025.
Related past issues
- You Thought You Just Had to Buy GPUs? The Real Battleground of the AI Infrastructure War ··· Issue 17. The issue that first mapped out the three axes of chips, power, and memory.
- Data Centers Aren’t Stalling Because of Money or Chips ··· Issue 141. A ground-level look at the 5-year transformer lead time.
- $800 Billion, the World’s Most Famous Wrong Number ··· Issue 181. A story about how a number changes when its definition changes.
- The Next Battlefield in AI Chips Is Memory ··· Issue 219. The internal structure of the $15 memory slice.

📝 Glossary
Footnotes
-
Sankey diagram: A chart that represents the size of a flow using the thickness of a line. A total quantity on the left branches into several paths moving right, and the thickness of each branch shows the size of its share. It’s widely used to depict energy flows or budget allocations. ↩
-
HBM (High Bandwidth Memory): Memory made by stacking DRAM chips in multiple layers and placing them right next to the GPU. It moves data through a much wider channel than ordinary memory, making it an essential component of AI accelerators. It’s made by three companies: Samsung Electronics, SK Hynix, and Micron. ↩
-
Optical transceiver: A component that converts electrical signals into light to send over optical cable, and converts received light back into electrical signals. It’s used inside data centers to connect server racks to switches, and it gets replaced alongside GPU generation changes as required speeds rise. ↩
-
CDU (Coolant Distribution Unit): A device that sends coolant to the cold plates attached to chips and recovers the heated water, passing it on to the building’s cooling infrastructure. In liquid-cooled data centers, it acts as the relay between the racks and the building’s facilities. ↩
-
Depreciation and useful life: Depreciation is the accounting method of spreading the cost of equipment over its period of use rather than expensing it all at once, and that period of use is called the useful life. Extending the useful life reduces the expense recorded each year, which increases that year’s profit. ↩
Related issues
The Company That Asks Marketers What They've Built
Andrew Ng says AI won't destroy jobs, then admits his marketers all know how to code.
BusinessFrance Killed Its Cold-Call Opt-Out List
France scrapped its do-not-call registry for opt-in consent, even as voice spam keeps climbing in Korea.
BusinessThe Phone Kids Get at Dinner Isn't for Learning
New York just banned generative AI in public schools for a year, but Korea's real screen-time problem sits at the dinner table.
Business
Your take shapes the next issue
What resonated most in this issue, or where has your experience been different?