

Google Ads Has Been Dying for 25 Years
Twelve obituaries came and went, revenue crossed $294 billion—so what does that curve leave out?
BusinessOne Curve, Twelve Obituaries
Reader, there’s a chart going around titled “Google Ads is dead.” On a blue line that climbs steadily upward from 2000 to 2026, tracking ad spend, someone has pinned a year-by-year speech bubble for every death sentence the industry has issued along the way.
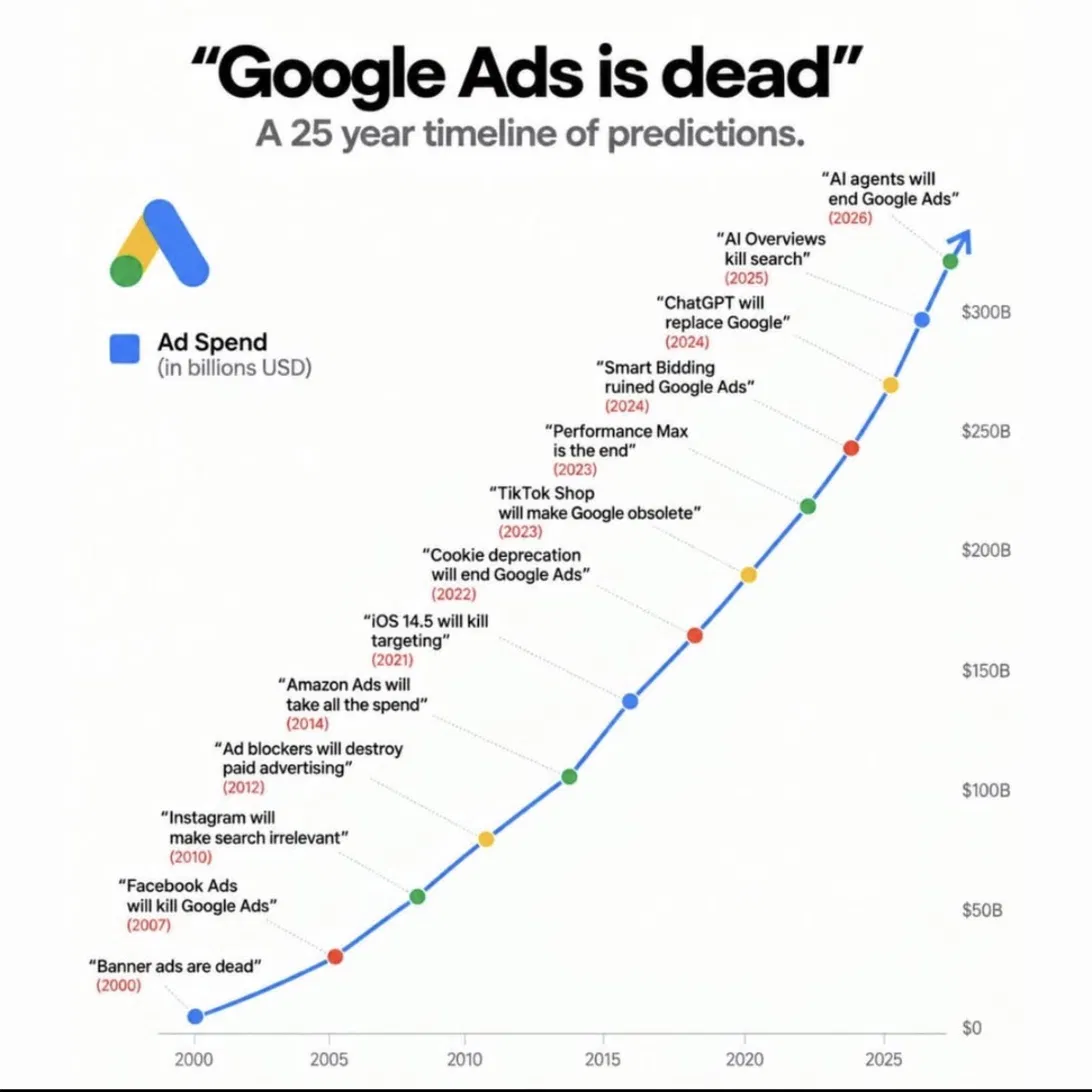
The post that circulates with this chart sums it up like this: Google Ads keeps evolving. People search before they buy. Buying habits change slowly. As evidence, it cites more than 14 billion searches a day, $294 billion in 2025 ad revenue (up 14%), 17% search-revenue growth in Q4, and AI Max as the fastest-growing search product. The sharpest line comes last: even AI Mode, the newest “killer,” still runs ads beneath its answers.
The message is clear: there have always been people crying wolf, and the curve has never once bent downward—so this round of agent talk is just more noise. Half of that conclusion checks out against the numbers. The other half lives in what the chart doesn’t draw.
The Numbers in the Rebuttal Mostly Check Out—Except One
Let’s start with what’s right. In Q4 2025, Google’s Search & Other revenue hit $63.1 billion, up 17% year over year.1 Looking quarter by quarter across 2025, search growth climbed steadily: 10%, 12%, 15%, 17%.2 The very year tagged with “AI Overviews will kill search” turned out to be the year search revenue accelerated the fastest.
This year the pattern holds. Search revenue grew 19% in Q1 2026 and 17% in Q2, reaching $63.3 billion.34 A breakdown of the Q2 filing shows paid clicks up 13% and cost-per-click up 3%.5 In other words, this wasn’t growth purely from raising prices—the number of times ads actually got clicked went up too.
The number that’s wrong is the annual growth rate. Add up Google’s quarterly ad revenue for 2025 and you get roughly $294.7 billion—so the $294 billion figure itself checks out. But compared with roughly $264.6 billion in 2024, that’s growth of about 11%, not 14%. The 14% figure actually belongs to Google Services overall in that same Q4.1 Getting this wrong doesn’t flip the conclusion, but it’s worth remembering: the more confident a post sounds, the more likely its numbers have been quietly rounded up a notch.
The AI Max line has also been stretched slightly. What Google actually said in its Q3 2025 earnings call was that AI Max is growing the fastest “among AI-powered search ad products,” with hundreds of thousands of advertisers already using it shortly after its global rollout.6 The comparison has quietly shifted from “AI-powered ad products” to “search products” as a whole.
What Curve Is This Graph Actually Showing
Now let’s look at the graph itself. The vertical axis just says “Ad Spend (in billions USD).” It doesn’t say whose ad spend. The $300 billion mark near 2025 roughly matches Google’s ad revenue, so it’s natural to read this as a chart of Google’s ad revenue.
But the earlier part doesn’t line up. The curve sits near $30 billion in 2005, yet Google’s total revenue that year — ads plus everything else — was only about $6.1 billion. The point around 2014 sits near $100 billion, but Google’s actual ad revenue that year was about $59.6 billion; the 2020 point is close to $190 billion, when the real figure was about $146.9 billion. The speech-bubble placements are off too: the Facebook “prophecy” labeled 2007 is attached to a point near 2005, and the Instagram prophecy labeled 2010 is attached to a point near 2008.
The quotes have quotation marks, but no attribution. There’s no way to check who said them, in what publication, or in what context. So this graph looks less like a record of failed predictions and more like a picture where neatly-trimmed, easy-to-refute sentences have been hung on an upward-sloping curve. That doesn’t mean the conclusion is wrong. But it’s worth knowing, going in, that this image is rhetoric, not evidence.
Surviving Isn’t the Same as Keeping Your Share
The first thing the graph doesn’t show you is market share. The curve only plots one company’s revenue — Google’s. While the overall market keeps growing, a single company can lose share and still watch its revenue curve climb.
eMarketer projects that Google’s share of the US search advertising market will fall to 48.5% in 2026 — the first time it’s dropped below half in roughly 20 years. The biggest winner of that lost share is Amazon.7 Taken literally, the 2014 speech bubble reading “Amazon is taking all the ad spend” was wrong. But reframe it as “a sizable chunk of the search ad budget is leaving Google,” and it turns out to be fairly accurate. The speech bubbles hovering over Facebook, Instagram, and TikTok tell a similar story. None of them killed Google, but they did give advertisers more places to spend their money.
What’s interesting is that the opposing prediction kept getting pushed back too. eMarketer’s forecast for when Google’s search ad share would drop below 50% started at 2024,8 then slid to 2025,9 and now sits at 2026.7 In its forecast this past February, eMarketer pegged Google’s 2026 US ad revenue growth at just 5.6%, well behind Amazon’s 17.9% and Meta’s 14.2%.10 These forecasts are US-only, while the growth rates companies report in earnings are global, so they aren’t directly comparable — but even so, first-half results this year are already running ahead of the slowdown that was predicted.
Both the “Google is dying” camp and the “Google is unstoppable” camp are arguing from the same single curve. What actually happened was neither. Google got bigger, and at the same time, its slice of the advertising market slowly shrank.
The advertiser’s curve has to be drawn separately
The second thing missing is the advertiser. Google’s ad revenue growing means advertisers paid Google more. It doesn’t mean advertisers earned more as a result.
Looking at the speech bubbles again, the three from 2023–2024 are a different kind of claim. “Performance Max is the end,” “Smart Bidding ruined Google Ads” — these aren’t prophecies that a competitor will kill Google. They’re complaints that Google’s own automation has narrowed how much control advertisers have over picking keywords, bids, and ad placement. The chart lumps this complaint in with the death-prophecy list, framing it as: Google is doing fine, so the complaint must have been wrong too.
That pattern continues. Google stated that in Q1 2026, more than 30% of customer search ad spend ran through AI-driven campaigns like AI Max or Performance Max.11 Agencies that Digiday spoke with said AI Max opened up new search-query territory and increased search budgets, with some reporting annual spend rising 7–10% as a result. The article also notes that higher spending isn’t necessarily a sign of satisfaction.12
The more advertisers hand over decisions about where and how much to spend to machines, the more Google’s revenue curve and advertisers’ profit curve can diverge. Google’s earnings reports only ever show us the first curve.
Will AI Agents Make This Time Different
Let’s go back to that last speech bubble. The eleven before it were mostly about new places to show ads (feeds, shopping sites, short-video apps) or new ways of tracking people. Either way, the underlying assumption stayed the same: a person looks at a screen and clicks on something.
If an AI agent does the comparing and the paying instead, that assumption breaks down. The one reading the ad might not be a person at all. That said, Google isn’t just sitting still. It’s testing ads below AI Mode answers, and also piloting Direct Offers, which surfaces discounts straight to shopping users.13 Google has also said that ads attached to AI Overviews are monetizing at a rate comparable to traditional search.6

Oswarld’s Lens
What stands out most in this graph isn’t the failed prophets—it’s the incentives of whoever made the graph in the first place. I haven’t been able to confirm who first created the image. But “it’s dead” is a great pitch for selling new tools and new courses, while “it’s fine” is a great pitch for selling continued ad management services. Different directions, same underlying move: both are ways of trading on anxiety. One side inflates the fear, the other mocks it.
The more useful question, to my mind, isn’t “dead or alive”—it’s “handed over to whom, how much.” Google hasn’t died in 25 years. Instead, it has handed off a slice of ad budgets to Amazon and Meta, while gradually taking back control over bidding and targeting from advertisers. When agents arrive, something will shift hands again—whether that’s Google’s revenue, advertisers’ control, or the human click itself, you can’t tell just by staring at Google’s revenue curve.
So if you want to use this graph in a company meeting deck, I’d add one more slide: your own account’s cost-per-conversion over the past few years, and how your ad budget has actually split across channels. Google’s curve only proves that Google is doing fine.
Closing
There’s a good chance Google ads won’t die this time either. At least, that’s what the first-half numbers this year say. But “it didn’t die” isn’t the answer advertisers actually need. What the 25-year curve obscures is who captured the gains, who gave up control, and who paid the cost.
💬 Over the past two years, has Google’s share of the ad budgets you manage grown or shrunk? If it shrunk, tell us in the comments where that money went instead.
📨 If someone around you keeps saying “Google ads are finished” or “Google ads are untouchable,” send them this piece.
Already a subscriber? Sign in to join the conversation


References & Further Reading

Footnotes
-
Alphabet Investor Relations, 2025 Q4 Earnings Call · Q4 search ad revenue of $63.1B (+17%). For Google Services segment’s Q4 +14% figure, see the Investing.com full earnings call transcript. Annual ad revenue and growth rates are calculated by summing quarterly disclosures. ↩ ↩2
-
Search Engine Journal, Google Search Hits $63B, AI Mode Ad Tests Detailed (2026-02-05) ↩
-
Investing.com, Alphabet Q2 2026 Full Earnings Call Transcript (2026-07-22) ↩
-
Axis Intelligence, Google Ads Statistics 2026 · A third-party summary of changes in paid clicks and cost-per-click from the Q2 2026 10-Q filing. ↩
-
Alphabet Investor Relations, 2025 Q3 Earnings Call · Explanation of AI Max. For remarks on AI Overviews monetization, see the full Motley Fool transcript. ↩ ↩2
-
eMarketer, US Search Advertising Forecast 2026 (2026-05-14) ↩ ↩2
-
eMarketer, As the duopoly stagnates, Amazon is hot on Meta’s tail ↩
-
eMarketer, Exclusive data: 4 trends in paid search advertising (2024-10-01) ↩
-
Yahoo Finance, Alphabet Q1 Earnings Call Highlights (2026-04-29) ↩
-
Digiday, Google’s AI Max has pushed up search budgets – and costs (2026-05-06) ↩
-
Yahoo Finance, Alphabet Q4 Earnings Call Highlights (2026-02-04) ↩
Related issues
541,000 EV Chargers Later, Drivers Still Ask: Does It Work?
Korea counts chargers by the unit; drivers judge infrastructure by whether one plug actually works and what it costs per kWh.
BusinessThey Stole an Nvidia Trailer. It Was 18 Tons of Sand
Two trailers bearing the Nvidia logo vanished, and when thieves pried the doors open, all they found was sand.
BusinessPhone Discounts Now Hide in the Plan, Not the Price
A year after Korea's subsidy cap ended, switching rose only 1.5%—savings now hinge on the whole contract, not the device price.
Business
Your take shapes the next issue
What resonated most in this issue, or where has your experience been different?