

US Women Now Outnumber Men in Paid Jobs
What the payroll flip reveals about male job losses—and what Korea's decade of data already showed.
SocietyWomen Have More Jobs Than Men Now—So What Happened to Men’s Employment?
Last week, news broke that the US job-count gap between genders had flipped. American women now hold 176,000 more payroll jobs1 than men do. According to July data from the Bureau of Labor Statistics, women held 79,517,000 jobs, or 50.1% of the total. This is only the third time this has happened in US history.
What caught my attention wasn’t just the rise in women’s jobs, but the reasons behind the simultaneous decline in men’s jobs. Both shifts happened at once.
Job counts alone can’t tell us whose situation actually improved. Men still face declining hiring, while women still contend with problems around pay and job quality. Korea went through a similar reversal ten years ago, and now has a decade’s worth of data since then.
176,000 is barely 0.1% of all payroll jobs
The moment I read the article, the first thing I checked was the scale of that number, 176,000. Total payroll jobs sit around 159 million, so 176,000 is barely 0.1% of that — the gap between roughly 79.517 million women and 79.34 million men.
But the US Bureau of Labor Statistics is set to release its preliminary March benchmark revision on August 282. That revision typically shifts employment levels up or down by hundreds of thousands. Which means this much-discussed reversal could either survive that single revision intact, or quietly vanish within its margin. In other words, it’s too early to treat “the reversal happened” as settled fact.
Historical precedent backs up that caution. The same thing has happened twice before: once during the Great Recession spanning 2009 to 2010, and again in November 2019, when women’s share briefly touched 50.1%. Both times, it reversed back. The first was because male-dominated manufacturing and construction collapsed first in the downturn; the second was because the pandemic hit female-dominated retail and hospitality hardest. In both cases, it was a temporary crossing produced by the business cycle.
There’s exactly one reason to think this time is different: it happened without a recession. Laura Ullrich, head of economic research at Indeed Hiring Lab, argues that this shift doesn’t fit the old pattern that used to show up only during downturns. Her reading is that this looks more like a semi-permanent shift produced by a long-term decline.
I think three numbers behind the reversal matter more than the reversal itself.
- Over the past 12 months, men’s job count fell by a net 142,000, while women’s rose by 298,000.
- From February 2024 to February 2026, roughly two-thirds of the 1.2 million jobs added went to women.
- Since record-keeping began in 1948, the US male labor force participation rate3 has dropped from 86.7% to 67.2% — a decline of about 20 percentage points. Over the same period, the rate for women climbed from 32% to 57.2%.
While women’s participation rate rose by 25 percentage points, men’s fell by 20 points. The convergence in job numbers can’t be explained by the rise on the women’s side alone.
But ‘women won’ isn’t true either
The way this news is being consumed worries me a bit. If we read 50.1% as a victory for women, other indicators—like wages or job quality—drop out of the conversation entirely.
50.1% is the number of jobs. It’s not wages, not job rank, not assets. Analysis from the Korean Women’s Development Institute shows that Korean women’s average monthly wage is 29.0% lower than men’s, and this gap is the largest among OECD member countries. Korea has held the number one spot in this statistic essentially every single time since the OECD started comparing it.
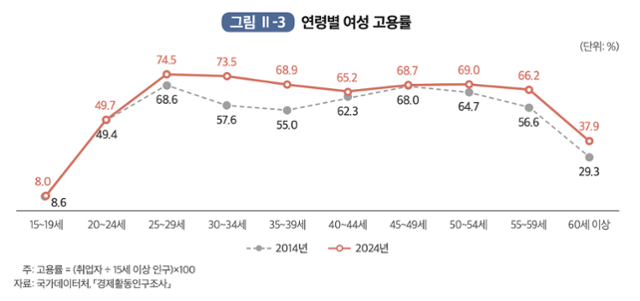
Graph of women’s employment rate by age, 2024. Women’s Economic Activity White Paper
The flattening of Korea’s M-curve4 tells a similar story. Looking purely at the numbers, things have clearly improved. The employment rate for women aged 30-34 hit an all-time high of 73.5% in 2025, and the 35-39 age group climbed to 68.9%. The employment rate for women aged 15-64 stands at 62.1%, the highest since records began.
But a substantial portion of this flattening is the product of rising numbers of unmarried people and higher education levels. Put a bit more coldly: the very situations that would have interrupted a career—marriage, childbirth—simply aren’t arising for as many women anymore. In a country with a total fertility rate of 0.75, it’s hard to read a flattened M-curve as a sign that the underlying structure of discrimination has loosened. There are also persistent reports that the job quality for women in their 40s and 50s—who are now in the curve’s re-ascending segment—is more precarious than it was when they were in their 20s and 30s.
To sum up: the female employment rate has indeed risen, but wages and job quality haven’t necessarily improved along with it.
Korea Went Through This 10 Years Ago
Here’s why I don’t see this news as an America-only story.
The reversal America just experienced for the first time this month is one Korea already went through. Women’s employment rate surpassing men’s in the 25–29 age bracket happened in 2016. And it never reversed back. As of 2025, women’s employment rate in this age group stands at 74.5%, holding the gap steady.
I can’t put America’s numbers and Korea’s numbers side by side directly — America’s reversal is measured by total payroll jobs, Korea’s by employment rate in a specific age bracket. But the direction is the same. The flip happens first among younger workers, and that flip doesn’t reverse. Korea already has ten years of data showing what comes after.
So what happens after the reversal? Looking at Korea’s experience, employment conditions didn’t improve for men or for women.
The English draft matches the Korean source accurately with no distortions, omissions, number mismatches, or glossary violations. No corrections needed.
The industries shrinking and growing split cleanly along gender lines
Korea’s youth employment indicators are quite grim right now. As of July 2026, the youth employment rate has fallen for 27 consecutive months, and the number of employed young people has declined for 45 consecutive months. In June alone, employment among people in their 20s dropped by 199,000. The expanded unemployment rate5, which includes job seekers in preparation and those who’ve given up looking, remains around 16%. That means more than one in six young people is effectively unemployed or underemployed.
Which industries lost jobs? Manufacturing has declined for 24 consecutive months, shedding 97,000 jobs in June alone, while construction fell for 25 consecutive months, losing 67,000. By contrast, healthcare and social welfare services added 214,000 jobs in the same month, and employment among people 60 and older rose by 211,000 — propping up the overall employment figures.

The same pattern shows up among young people who report neither seeking work nor working — simply “resting”6. According to an analysis by the Korea Employment Information Service, men make up 55.8% of this group.
The US shows the identical structure. Ullrich pointed to the decline in male-dominated tech and financial-services jobs as one reason virtually all of America’s job growth over the past year has gone to women.
Hiring has fallen in industries where men predominated, and jobs have grown in sectors with a higher share of women. It’s hard to explain this shift in employment simply as a matter of individual willingness to work. Gender employment statistics look less like a gender indicator than a lagging indicator of industrial restructuring.
We also need to reckon with the sense of deprivation young men feel as job openings shrink. The problem is how that deprivation gets explained away as the fault of individual young men.
The ‘70% on games’ figure doesn’t match the original paper
There’s a sentence that shows up in almost every article covering this topic: that a study found young men spend about 70% of their non-working hours on video games and recreational computer use. You can probably guess how this line gets deployed—at bars, in conference rooms, around holiday dinner tables.
So I tracked down the original paper and read it. It’s a study by Aguiar, Bils, Charles, and Hurst, published in the Journal of Political Economy in 2021. Here’s what it actually says.
Men aged 21 to 30 shifted their leisure time significantly toward gaming and recreational computing after 2004, and over the same period their work hours fell more than those of older men or women. The researchers estimated that improvements in leisure technology account for roughly half of the increase in leisure time, translating into a work-hour decline of somewhere between 1.5% and 3.0%. That range corresponds to 38% to 79% of the gap reduction relative to older men.
This is a conditional estimate—and an interval estimate whose upper bound is more than double its lower bound. That’s a very different claim from “70% of non-working hours.”
The paper also carries a footnote worth noting. The “gaming” category in the American Time Use Survey doesn’t distinguish video games from card games and board games like Scrabble—they’re all lumped together. The authors themselves wrote that what they’d captured might be a Scrabble boom rather than a video game boom. It’s a scholar honestly flagging the limits of their own data—but somewhere along the way, that footnote vanished while the number kept growing.
A conditional estimate meant to explain a cause ended up as ammunition for indicting an entire generation.
Oswarld’s Lens
The failure I see most often in consulting work is misdiagnosis—looking for the cause in entirely the wrong place. Walk into a company with falling revenue, and management almost always points first at the sales team’s attitude. Someone always says, at least once in the meeting room, that “kids these days just don’t have the hunger.” But when you actually pull apart the data, the cause is almost always somewhere else—channel structure, pricing, product lifecycle. Blaming attitude is convenient for a simple reason: fixing structure is hard and expensive, but blaming people is free.
The lecturing aimed at young men follows the same pattern. Explaining 24 consecutive months of decline in manufacturing and 25 consecutive months of decline in construction requires touching industrial policy and vocational training systems. Blaming games, on the other hand, you can do right at the dinner table tonight.
When I teach data courses, the first question I always have students ask is, “What exactly does this number explain?” When I look at men and women in their 20s together in the classroom, I can see that the two groups are worried about different things. The men feel that the jobs themselves have disappeared, while the women worry about whether they’ll be able to keep working long-term once they’re hired. Both worries are legitimate. But once these two worries start pointing at each other as the cause, whoever cut hiring and whoever made long-term work difficult both walk away without any accountability.
To be fair, I’ll leave room for the other side of the argument too. I don’t think the research direction claiming that leisure technology affects labor supply is wrong in itself. It’s clear that the quality of smartphones and games isn’t what it was 20 years ago. But the magnitude of that effect has to be discussed within the range the original paper actually presents—and that range isn’t large enough to justify calling an entire generation lazy.
Closing
Let me sum this up in three lines. The 176,000 gap that made headlines in the US is small enough to vanish with the August 28th statistical revision, and the more important shift is that the male labor force participation rate has fallen 20 percentage points over 78 years. Korea already passed this reversal back in 2016, and since then women have kept getting pushed out on wages and job quality, while young men have been pushed out of entry itself by the shrinking of manufacturing and construction. And while this structure keeps drawing the same lecture — that they’re “not working because they’re too busy gaming” — the number cited as evidence for that lecture has drifted from what the original paper actually said.
So let me leave just two indicators to watch going forward. Whether the reversal in the US holds up after the August 28th benchmark revision, and when Korea’s manufacturing employment count stops declining. Watching whether manufacturing employment stops falling is also how we’ll be able to judge whether employment conditions for young men are actually improving.
How is it where you are, Reader? Tell me in the comments where you’ve heard someone say “kids these days have gotten lazy” — and, on the flip side, exactly where you feel like you’re being pushed out. The problem of struggling to get hired in the first place and the problem of struggling to keep working after getting hired call for completely different solutions. Once enough cases come in, I’ll break them down by generation in the next issue.
💬 Tell me in the comments where you’ve heard someone say “kids these days have gotten lazy,” or where you’ve felt pushed out yourself. 📨 If you have a colleague who handles hiring or organizational management, pass this piece along to them.
Keep the perspective, not the noise.
We choose one consequential shift and trace what sits beneath it, every other day.
Confirm once to finish subscribing.
Already a subscriber? Sign in to join the conversation


References & Further Reading
Primary sources
- Mary Julia Koch, “Young Men Are Abandoning the Workforce”, WSJ Free Expression, 2026. 8. Link ··· This is where today’s piece starts. It’s the column that first put the 176,000 figure into circulation.
- Fortune, “The stay-at-home boyfriend is now an economic trend as more women than men go to work”, 2026. 8. Link ··· The source for the 142,000 net decline in men and the 298,000 rise in women. That said, this article’s lineage is also where the “70% gaming” line spread, so please cross-check that particular claim against the paper below.
- Laura Ullrich, “How Women Have Closed the Workforce Gender Gap”, Indeed Hiring Lab, 2026. 3. Link ··· The original analysis behind this round of “reversal” coverage. I’d recommend reading this before the news articles.
- TheStreet, “Women just claimed the majority of US jobs”, 2026. 8. 14. Link ··· The source for the point that the August 28 benchmark revision could erase this margin. This perspective is more useful than the celebratory framing.
- Mark Aguiar, Mark Bils, Kerwin Kofi Charles & Erik Hurst, “Leisure Luxuries and the Labor Supply of Young Men”, Journal of Political Economy 129(2), 2021. Link ··· The original paper behind “young men aren’t working because of video games.” The full NBER working paper is free to read, and the Scrabble footnote is in note 15.
- Korea Labor Institute (Hangukhoedong Yeon’guwon, a state-run labor research institute), “2025 Labor Market Assessment and 2026 Labor Market Outlook”, Employment and Labor Brief No. 114, 2025. 12. Link ··· The source of the summary “women’s employment is solid, men’s remains sluggish” and the drop in male sub-bachelor’s manufacturing employment.
- Korea Women’s Development Institute (Hanguk Yeoseong Jeongchaek Yeon’guwon, a state-run gender policy research institute), “Key Features and Implications of the Recent Female Labor Market”, 2025. 11. Link ··· The source of the timing of women overtaking men in the 25–29 age group, along with 74.5%, the 73.5% figure for ages 30–34, and the 62.1% female employment rate.
Background
- Korea Women’s Development Institute, “Korean Women Earn 29.0% Less Per Month Than Men on Average”, 2025. 8. Link ··· A reminder that job counts and wages are two different stories.
- Hankook Ilbo (a major Korean daily newspaper), “Despite Easing Career Breaks Among Women in Their 30s, Childbirth Avoidance Persists — The Hidden Truth Behind M-Curve Statistics”, 2026. 1. Link ··· Lays out why you shouldn’t read the flattening M-curve as evidence that discrimination has disappeared.
- Korea Employment Information Service (Hanguk Goyong Jeongboweon, a state-run labor market data agency), “Characteristics and Transition Analysis of Young People Who Are ‘Resting’”, Employment Trends Brief No. 9, 2025. 12. Link ··· This is where the 55.8% male share among “resting” young people comes from.
- Financial News (a Korean business daily), “June Employment Up 63,000, Youth Employment Rate Falls for 26th Straight Month”, 2026. 7. 15. Link · National Manpower News (Jeonguk Illyeok Sinmun, a Korean labor-market trade paper), “Employment Falls for 45th Straight Month — A Structural Diagnosis of 27 Months of Declining Youth Employment”, 2026. 8. Link ··· Between these two articles you can piece together the consecutive declines in manufacturing and construction alongside the rise in healthcare and welfare.
- Kyunghyang Shinmun (a major Korean daily newspaper), “Late-20s Employment Rate: Women Have Overtaken Men”, 2018. 4. Link ··· The article that first reported Korea’s reversal. The Employment Information Service put the turning point at 2017, while the Women’s Development Institute counted it as 2016 — a one-year gap that comes down to differing statistical criteria.

📝 Glossary
Footnotes
-
Nonfarm payroll: Employment statistics compiled by the U.S. Bureau of Labor Statistics through surveys of businesses. Agriculture and self-employment are excluded, and a person holding two jobs gets counted twice. ↩
-
Benchmark revision: The process of recalculating survey-based employment statistics to match comprehensive administrative data, such as unemployment insurance records. It happens annually, and the numbers can shift by hundreds of thousands. ↩
-
Labor force participation rate: The share of the working-age population that is either employed or actively looking for work. If someone gives up job hunting, they disappear from the unemployment rate but drag this indicator down. ↩
-
M-curve: The pattern seen when women’s employment rate is plotted by age group — a dip in the 30s that makes the graph resemble the letter M. It’s shaped by career interruptions from childbirth and childcare. ↩
-
Extended unemployment rate (Employment Auxiliary Indicator 3): A measure that adds job seekers in preparation, discouraged workers who’ve given up searching, and underemployed part-timers who want more hours to the official unemployed count. It comes closer to capturing unemployment as people actually experience it. ↩
-
“Resting” (sswieoteum, roughly “just taking a break”): People outside the labor force who, when asked why, say they were “just resting” — with no specific reason like childcare, study, or illness. They don’t show up in unemployment statistics, but they are, in effect, outside the labor market. ↩
Related issues
The Drunk Monkey Hypothesis and Korea's Drinking Puzzle
A famous tipsy-monkey study offers surprising context for a shift in who's drinking heavily in Korea today.
SocietyInsightful's 92% Utilization Score Doesn't Add Up
A vendor's own CEO says scores above 90% look suspicious, even as its customer testimonials brag about hitting 92%.
SocietyKentucky Mother and Daughter Reverse $26M Land Deal
A Kentucky mother and daughter signed a $26.48 million land deal, then reversed it after an NDA hid what the buyer really wanted.
Society
Your take shapes the next issue
What resonated most in this issue, or where has your experience been different?