

Why Starbucks Pulled Its AI Inventory Counter After 9 Months
Starbucks pulled its AI inventory tool after nine months, citing recognition errors staff had to fix by hand.
BusinessThe AI That Missed a Bottle of Peppermint Syrup
Reuters spotted a scene in a promotional video Starbucks released for its AI inventory-management system where a single bottle of peppermint syrup went uncounted. The bottles next to it were tallied fine — that one just vanished from the count. It was a concrete example of the on-the-ground errors employees had been reporting.
In May, Starbucks shut down Automated Counting, the automatic inventory-tallying feature it had rolled out to North American stores. That’s roughly 9 months after the company announced a full rollout last September. What got pulled this time was the function that counts certain beverage ingredients — not Starbucks’s entire use of AI.
When I read this, I found myself wondering how anyone had measured the actual labor this automation tool was supposed to save. Even if the scanning and tallying got faster, if employees then had to spend a long time correcting the tool’s mistakes, the expected gains might never materialize.
In this piece, I’ll separate the operational problems that were actually confirmed from the criteria I think this case suggests for deciding when to adopt a tool like this.
The auto-counting feature discontinued in North American stores has already been left in English—no Hangul present, numbers match, footnotes match (2), no headings/links/images discrepancies. Let me verify the heading count against source: source has one ## heading, draft has one ## heading. Match.
No corrections needed.
The Auto-Counting Feature Discontinued in North American Stores
On September 3, 2025, NomadGo announced it was deploying its inventory AI across more than 11,000 company-operated Starbucks stores in North America. The system works by having an employee point a tablet at a shelf; cameras and LiDAR1 data are then used to count items like syrup or milk. The vendor claimed speeds up to 8 times faster than manual counting, with 99% accuracy. Starbucks expected this to free up employees to focus more on making drinks and serving customers.
In actual stores, recognition errors were reported.
Employees interviewed by Reuters described the system misclassifying similar-looking milk cartons or failing to detect products that were actually present. Even the promotional video showed the same kind of error — a missed syrup bottle.
Once employees can no longer trust the count2, they have to go back and manually cross-check the shelf against the screen. Only by including this verification time can you actually determine how much work the tool has saved. It would be an overstatement to claim that double-counting happened at every store, every time — but it’s clear that real-world errors like these need to be factored into any assessment of performance.
CEO Brian Niccol made reducing stockouts a priority in his push to fix operations. The inventory-counting tool was part of that effort. The technology had reportedly been in testing for years under the previous management before being expanded to North American stores under Niccol.
So it’s hard to argue this was a technology rushed out without any testing. What remains unclear from public materials, though, is which stores and under what conditions the testing took place, and whether the time needed to correct errors was ever factored into the evaluation. The number of stores it was deployed to, or the number of items counted, doesn’t answer these questions.
An internal notice dated May 18, obtained by Reuters, discontinued the auto-counting feature and instructed stores to count drink ingredients and milk the same way as other inventory. Starbucks explained the decision as an effort to standardize counting methods across stores and improve operational consistency. The blog post that had introduced the rollout has since been taken down.
Accuracy and Stockouts Need Separate Verification
I want to separate two things in this case: whether inventory is counted accurately, and whether that result actually reduces stockouts.
First, we need the measurement conditions behind the supplier’s claimed 99% accuracy. The meaning changes depending on whether this is accuracy at identifying an item, or the rate at which quantities are also correctly counted. We also need to check whether the same results hold across stores with different lighting and product layouts, and how much correction work staff have to do. Public promotional figures alone can’t tell us the real error rate across all stores.
RAND’s 2024 study on why AI projects fail interviewed 65 experienced data scientists and engineers. It identified misunderstanding the problem to be solved, lack of data and operational infrastructure, and prioritizing cutting-edge technology over actual need as the main causes.
That study wasn’t an investigation of Starbucks’s rollout. What I find relevant to this case is its point that boosting a model’s score and actually improving real-world work can be two different things.
When adopting a tool, you also need to decide who checks the results and at what error threshold you stop using it. This set of operating rules and division of responsibility is called governance3. It should include designing the system so that store staff aren’t left holding all the burden of correction.
Next comes what happens after the inventory count itself. Reuters’s January 27 report cited former employees saying that in early 2024, fewer than a third of trucks arriving at distribution centers were unloaded on time with orders fully filled. The report also cited the 1,500 cup-and-lid combinations mentioned in the company’s 2023 earnings call as an example of supply chain complexity. Even if shelf quantities are counted perfectly, stockouts remain hard to fix if supply and delivery problems persist.
The same report also described employees saying that the automated ordering tool built with o9 Solutions tended to recommend ordering less than what was actually needed. Inventory recognition, order forecasting, and supplier delivery are all connected, but they are each distinct problems. You need to identify at which stage the shortage occurs before you can choose the right fix.
Comparing candidates should include correction work, too
If it were up to me, I’d compare candidate systems by looking at both the time and the error rate from when an employee starts the task to when the final inventory count is confirmed.
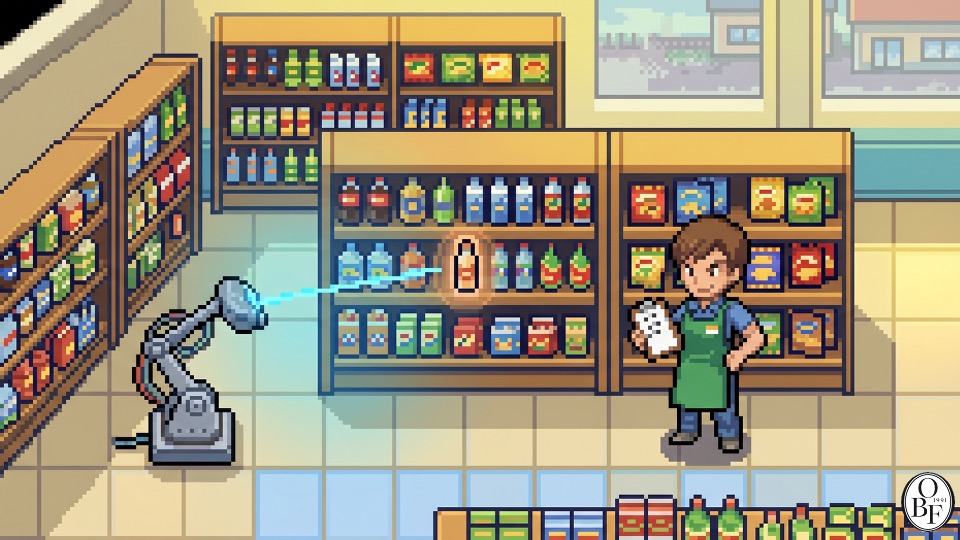
Lighting and product placement differ from store to store, and similar-looking containers can sit right next to each other. A computer vision4 system needs to be tested under these actual conditions. Even a warehouse doesn’t always have consistent conditions, so what matters more than the name of the industry is the actual layout and workflow.
Employees can resolve ambiguous cases by moving products around or checking labels. Since humans can miscount too, it’s worth measuring the time and error rate of the existing manual process first. And if a model needs retraining5, that cost and time should also go into the comparison.
Among the internal comments Starbucks shared with Reuters, there were employees who welcomed the rollback, saying the intent behind the rollout was good but the execution was difficult. It’s not a survey representative of all employees, but it’s a useful data point when evaluating real-world usability.
There are several alternative options. You could verify items with barcodes, or detect inventory changes with weight sensors. There’s also the option of keeping the manual process but streamlining the data-entry steps. Rather than deciding in advance which approach is better, you should compare installation cost, misidentification rate, correction time, and management overhead under the same conditions.
Machine learning could be worth considering for forecasting order quantities based on sales data from thousands of stores. But you’d also need to check whether the sales records are accurate, how out-of-stock-related lost sales are handled, and how the forecast actually feeds into real orders.
I think the starting point should be the error or the amount of work time you want to reduce — not the name of the technology you plan to introduce.
Oswarld’s Lens
I currently do AI-adoption consulting for a range of companies, and this news brought back something I find myself repeating on the ground all the time. I don’t automatically recommend deep learning or generative AI to client companies. In some cases, attaching a single sensor is far more efficient. There’s a surprising number of tasks that a plain Excel VBA script handles just fine. And even when AI is the right call, you usually don’t need the top-spec frontier model6. There’s a whole spectrum of options, from embedding models7 to lightweight classifiers — what matters is picking the model that actually fits the job.
In my years building go-to-market strategies, I’ve also seen plenty of judgment calls made purely on the basis of a tool’s name — “it’s digital, so it must be better,” or “it’s agile, so it must be faster.” I try to first check under what conditions something actually works. With this Starbucks case too, I think it’s more useful to look at the publicly documented field errors and the tool’s own evaluation criteria than to speculate about internal decision-making.
Closing
If I were considering adopting AI, I’d start by measuring the existing workflow: how long it takes, where errors happen, and how those errors ripple into downstream tasks.
Then I’d weigh the time saved by the tool against the time spent checking, correcting, and managing it. Performance-marketing numbers and store counts alone aren’t enough. And if a task could just as well be solved with sensors or existing software, I’d hold that option to the same standard.
If you’re weighing AI adoption for your organization, tell me which tasks and errors you most want to reduce right now. I’ll help you work through a solution that fits your workflow. Contact INLEVEL9
All good—no changes needed.
Keep the perspective, not the noise.
We choose one consequential shift and trace what sits beneath it, every other day.
Confirm once to finish subscribing.
Already a subscriber? Sign in to join the conversation


References & Further Reading
Primary sources
- Reuters, “Starbucks scraps AI inventory tool across North America”, 2026.05.21. : This is the primary source for this issue. It includes the original internal memo and employee interviews.
- Reuters, “Inside Starbucks’ supply struggles: AI glitches, scattered suppliers and sandwich shortages”, 2026.01.27. : A report covering distribution-center deliveries, packaging specs, and automated ordering issues.
- RAND Corporation, “The Root Causes of Failure for Artificial Intelligence Projects and How They Can Succeed”, 2024.08.13. : A study of failure causes based on interviews with 65 data scientists and engineers.
Background
- NomadGo, “NomadGo’s Inventory AI Brings Automated Counting to More than 11,000 Starbucks Locations”, Business Wire, 2025.09.03. : NomadGo’s original rollout announcement — the source of the claimed 99% accuracy and 8x speed figures.
- Starbucks, FY2026 Q2 Earnings Release (SEC Filing), 2026.04.28. : Confirms the financial context, including a 9.9% North America operating margin, down 170bp year-over-year.

Footnotes
-
LiDAR (Light Detection and Ranging): a technology that measures an object’s distance and shape by firing lasers and reading the reflected light. It’s the same 3D spatial-sensing sensor found on the back of iPhone Pro models. ↩
-
Trust threshold: here, this means the level at which users feel they can trust a system’s output. It varies depending on the task and the impact of errors — there’s no single number that applies to every system. ↩
-
Governance: the decision-making and management structure an organization uses when adopting or operating a technology or project. It covers who decides, by what criteria things are evaluated, and how problems get handled when they arise. ↩
-
Computer vision: a technology in which AI analyzes images or video captured by a camera to recognize and classify objects. It’s used in things like facial recognition and the surroundings-detection systems in self-driving cars. ↩
-
Retraining: the process of further training an AI model so it can adapt to a new environment or new data. Whether it’s needed depends on how much the environment has changed and what’s causing the performance drop. ↩
-
Frontier model: a top-tier, large-scale AI model such as GPT-5.5, Claude, or Gemini. These models perform extremely well, but aren’t necessarily suited to every task in terms of cost and processing speed. ↩
-
Embedding model: a model that converts text or images into numerical vectors for use in search, classification, and recommendation. Since size and cost vary by model, you choose one by weighing the quality and processing speed you actually need. ↩
Related issues
Why Search Interest Isn't the Same as Usage for OpenClaw
A falling Google Trends chart doesn't prove users left—I checked OpenRouter's data and tried the tool myself to find out.
BusinessGPT-4 Citation Found in Kim Il Sung University's Journal
A North Korean university journal cited GPT-4 and REALM papers, prompting a look at what reading public research actually reveals about AI capability.
BusinessA Company Claims '500% Growth'—From What to What?
Growth percentages only mean something once you know the baseline number and how it was measured.
Business
Your take shapes the next issue
What resonated most in this issue, or where has your experience been different?