

Tokens Flowed to Open Models, But Money Didn't Follow
In three months, DeepSeek's share jumped from 25% to 64%, but the same gateway's spending chart told the opposite story.
BusinessThe bar colors flipped in three months
Reader, there’s a bar chart on Vercel’s AI Gateway leaderboard1 that’s been bugging me lately. It stacks, day by day from June 29 to September 26, which lab’s models the tokens passing through this gateway ended up going to.
At the top of the legend is DeepSeek, at 64.4%. Below it: OpenAI at 7.5%, Z.AI at 6.4%, Anthropic and Google tied at 5.2% each, Moonshot AI at 2.9%, and StepFun at 2.0%. At the far left of the chart, three months ago, DeepSeek’s sky-blue slice took up only about a quarter of the bar. In three months, it claimed two-thirds of the whole pie.
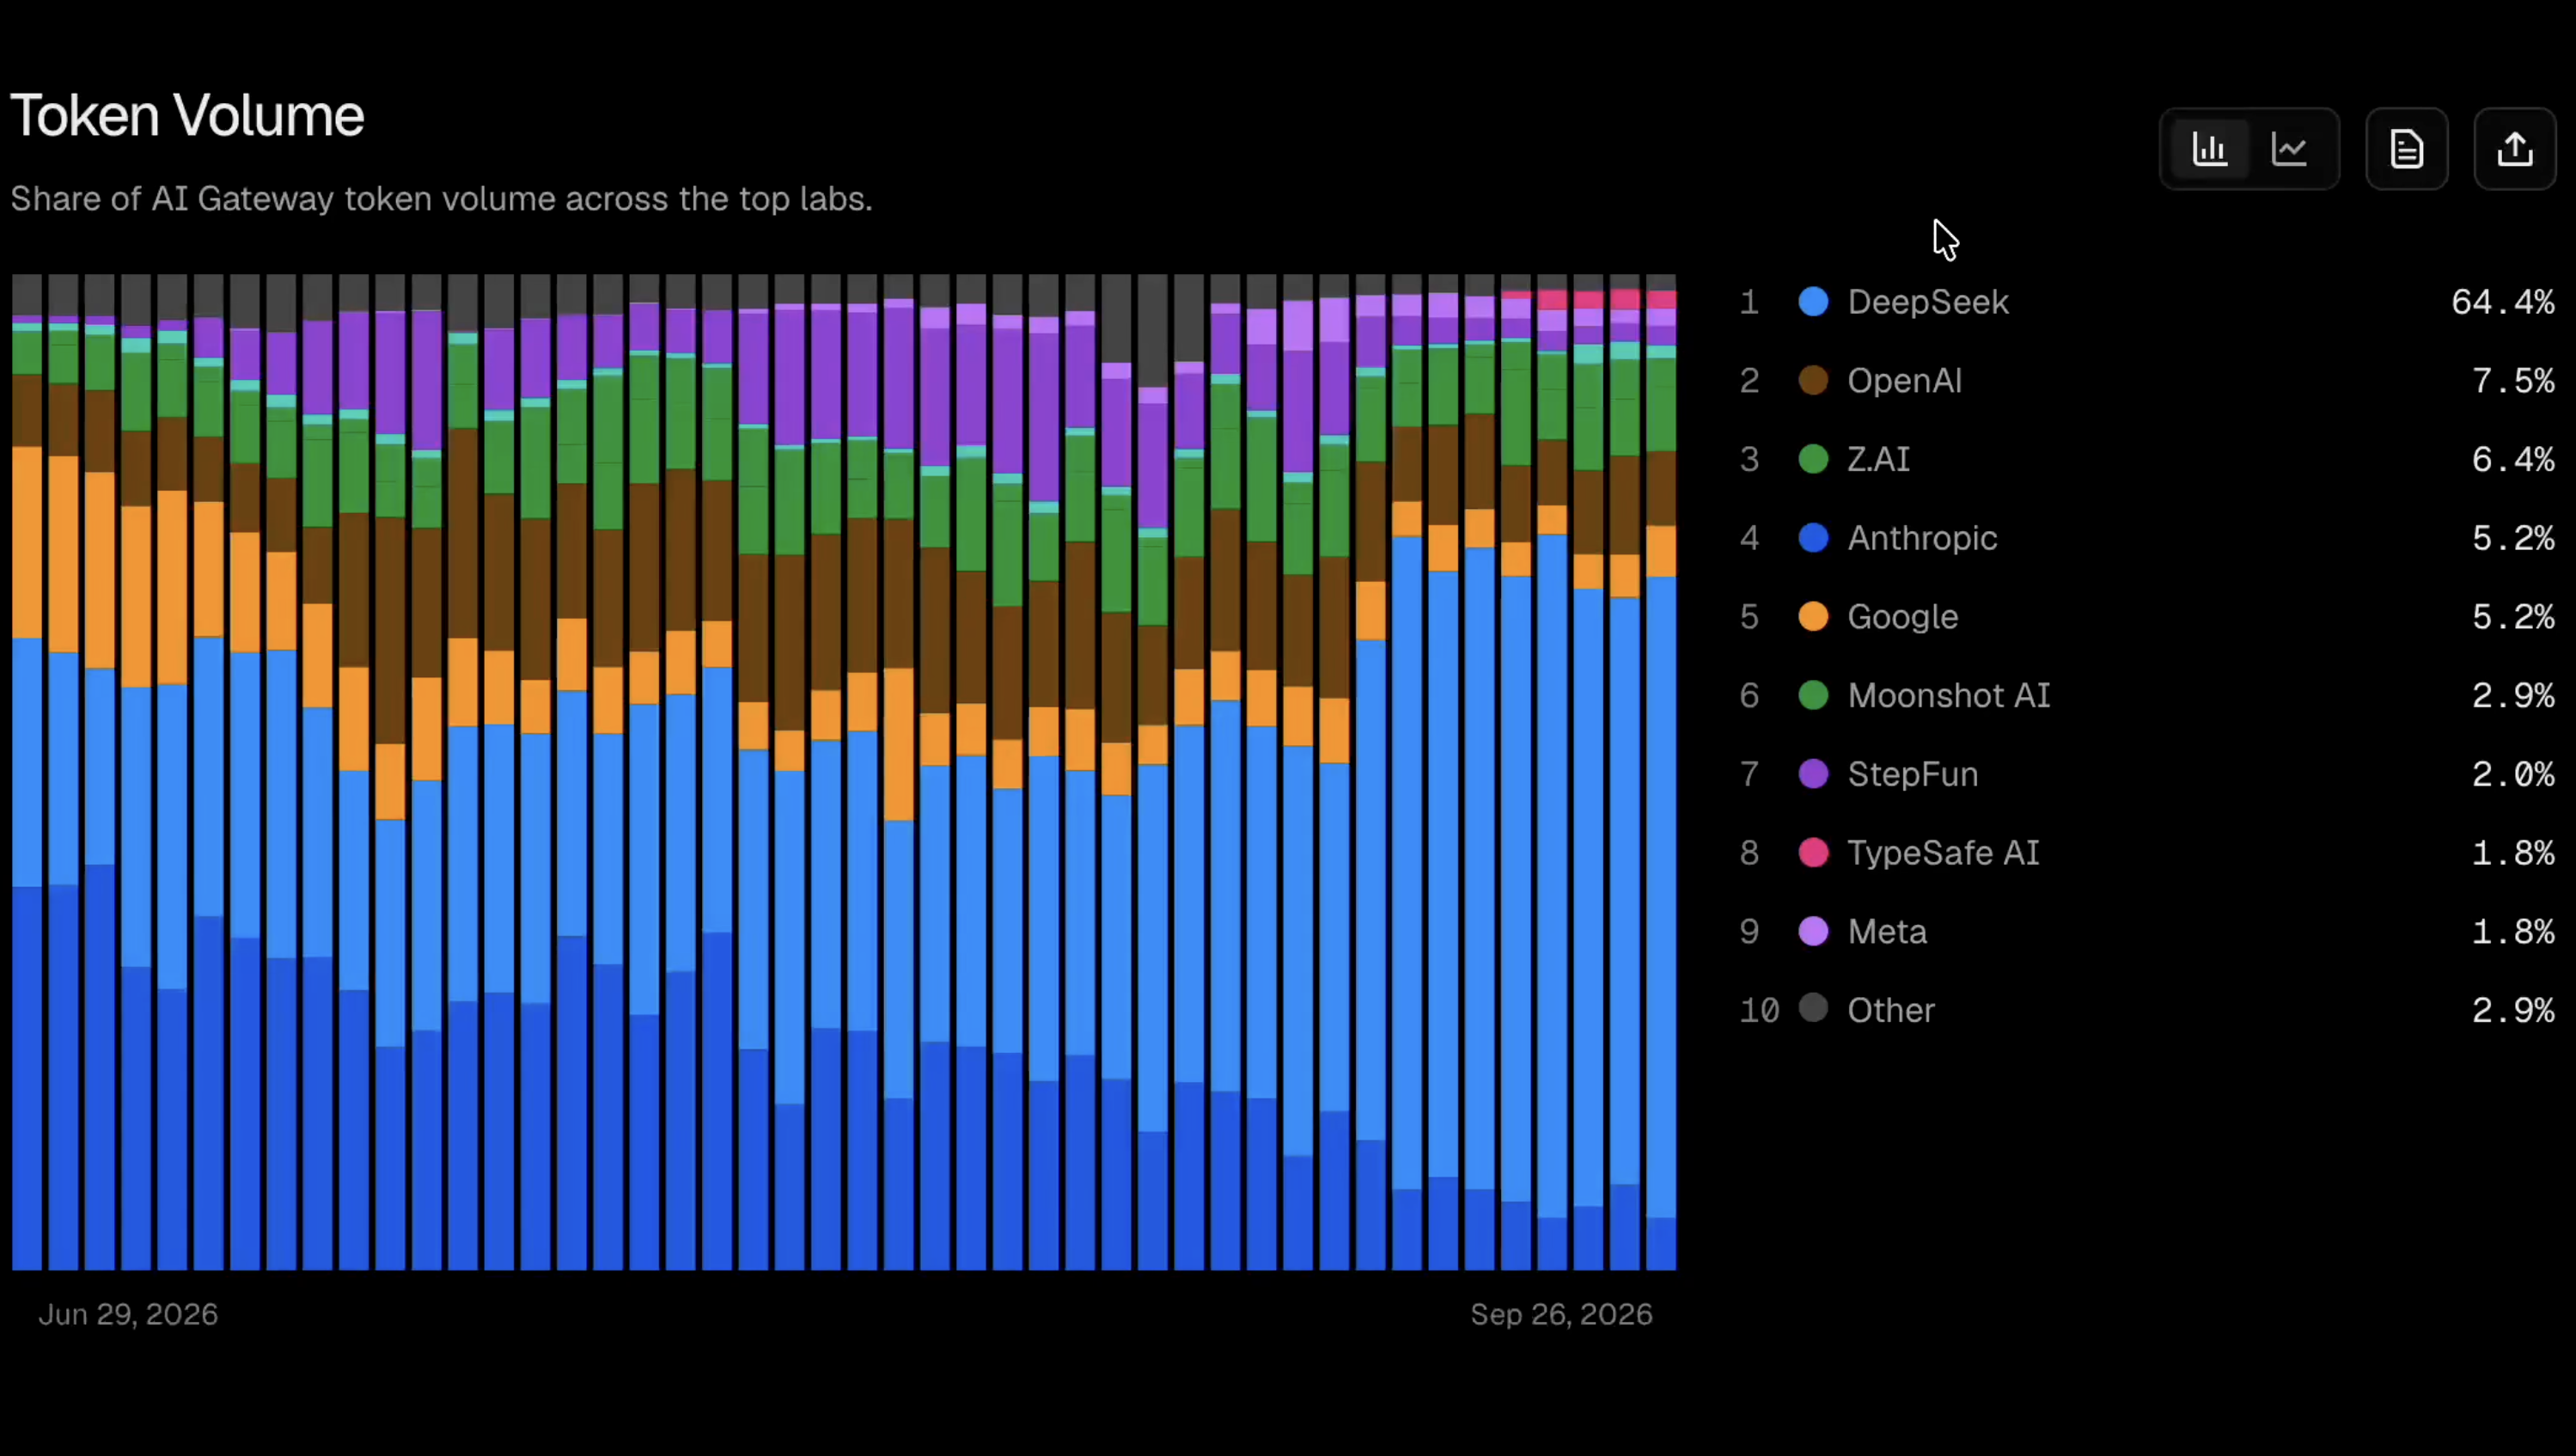
But scroll down a bit on the same leaderboard, and there’s another table — one that counts not tokens, but money: where the spending actually went. There, the order is almost reversed. Today, I want to split the claim “they’re winning” across these two tables and read it carefully.
This Chart Measures a Gateway, Not the Market
Let’s start with what this number actually measures. The Vercel AI Gateway is a middle layer that lets developers call models from multiple labs through a single API. The leaderboard aggregates anonymized traffic from teams that chose to use this gateway, and only ratios are published — never absolute volumes. You can’t tell from this chart alone whether the ratio shifted because overall gateway volume grew, or because a few large customers changed their routing.
It’s also worth looking at how tokens are counted. Vercel sums input, output, and reasoning tokens together with tokens read from cache and tokens used to write to cache2. Agents that repeatedly feed in long context, or large automated batch jobs, can inflate token counts substantially. Even when open-weight models’ share spiked to 78.4% on September 19 alone, the outlet that reported it noted that this figure reflects token share within a single gateway — not three-quarters of the market3.
That said, there’s no reason to doubt the underlying trend. Tracking Vercel’s monthly production index, the direction is unmistakable. In April, DeepSeek accounted for less than 1% of gateway tokens. It jumped to 17% in May, when DeepSeek V4 launched4, and climbed to 22.6% in June — closing within 2 percentage points of Google5. Looking at open-weight models as a whole, their share went from 7% in December 2025 to 56% in August of this year. This was the first time open-weight models crossed a majority of gateway tokens2.
The spending chart on the same screen runs in reverse
Now let’s look at the money side. In August, open-weight models processed 56% of tokens but accounted for only an estimated 14% of spend. That same month, 64% of spend went to Anthropic’s models. Anthropic’s share of spend hasn’t dipped below 61% even once since December 20256. The June figures make this even clearer: Anthropic processed 32% of tokens while capturing 61% of spend5.
Running the numbers for August: closed models took 44% of tokens and 86% of spend, while open-weight models took 56% of tokens and 14% of spend. Per token, closed models cost about 7.8x more. That said, this spend is estimated from each lab’s published list prices, so actual billed amounts may differ2.
What’s interesting is that people are reacting to price even within the expensive tier. Anthropic’s priciest model, Fable 5, lost two-thirds of its share of gateway spend in a single month, while Opus 5 — priced at half the cost — tripled its share2. Customers didn’t leave Anthropic; they just moved one tier down within Anthropic. It shows that even teams buying expensive tokens keep running the numbers.
What Cheap Tokens Handle, What Expensive Tokens Handle
So why did these two charts diverge? The task-level breakdown Vercel provides offers a clue. As of June, back-office agents used only 5% of tokens but accounted for 14% of spend — the most expensive task per token. B2B services used 46% of tokens for 60% of spend, while consumer services showed the reverse: 43% of tokens for just 26% of spend5.
In other words, teams aren’t picking a single model — they’re dividing the labor. High-volume, easily-reversible work goes to cheap models; work where mistakes are costly goes to expensive ones.
I’ve started working this way myself lately. If you compare costs on Ollama Cloud, which I use, the answer becomes obvious — even at trillions of tokens, it’s dramatically cheaper than Claude or GPT-6. And if you set up harness files like Skill.md or soul.md properly, performance holds up decently too. So for work that needs to run continuously or involves heavy repetition — tasks I used to hand off to GPT’s Luna-tier models or Sonnet — I’m now routing to DeepSeek or GLM.
That doesn’t mean I’ve abandoned the expensive models, though. Overall planning, orchestration across multiple models and tools, and drafting the initial blueprint — those still go to Claude or GPT-6.
In its May index, Vercel noted that Anthropic held onto 70-80% of spend in every high-stakes task category — AI app generation, back-office agents, coding agents4.
This division of labor is pushing prices down. In August, the average price per token on the gateway fell 23.2% — the third straight month of decline, and less than half of what it was five months earlier2.
One thing is worth clarifying here: open models capturing token share doesn’t mean that money is flowing to DeepSeek or Moonshot AI. Vercel CEO Guillermo Rauch himself flagged that this spending is mostly purchased from US inference providers, so it shouldn’t be read as revenue for Chinese labs3. Once a model’s weights are public, anyone can host it on their own GPUs and sell access. “Open models are winning” and “the companies that built open models are profiting” are two different statements.
What Does a 3.6% Bet Pay Back With
Looking at this table, I kept seeing a chart from a Wall Street Journal article from a few days earlier overlapping in my mind. The September 23 article cited an estimate from economist Stijn Van Nieuwerburgh at the Brookings Institution, reporting that from 2025 to 2032, U.S. data center and AI infrastructure investment would total $10.3 trillion — roughly 3.6% of GDP every year7. The article’s chart places this alongside historical infrastructure booms: railroads averaged 2.24% of GDP annually from 1870 to 1890, highways 1.13% from 1956 to 1973, and telecom/fiber-optic cable 1.1% from 1996 to 2003. AI comes in at 3.63%. A footnote beneath the chart notes that the AI spending figure is an estimate.
This investment only gets recouped if someone eventually pays for AI. Not by the number of tokens, but by the price attached to each token. And even though this is data from a single gateway, two trends are moving at once. Usage volume is climbing fast — gateway tokens grew 29% in a single month in June5. At the same time, the price per token is falling, and much of that growing volume is flowing to the cheapest models.
Whether volume will outrun the price decline, or the price decline will outrun volume, isn’t something this data can answer yet. But one thing is clear when you’re looking at a $10 trillion bill: the sentence “token usage is exploding” isn’t enough on its own. You have to look at what price tier that growth is happening in.
Oswarld’s Lens
I think open models are winning. At least in terms of volume of work. Going from 25% to 64% in three months isn’t a shift you can explain away as one or two teams experimenting. My own task list has shifted that way too.
But if you measure this victory in dollars, I think the verdict is still premature. On the same gateway, two-thirds of spending still goes to Anthropic, and that share hasn’t dropped below 61% in nine months. Teams aren’t abandoning the expensive models. They’re picking out, from the work they used to hand to expensive models, the parts that can be handed down to cheap ones instead.
My own work is split the same way. The repetitive, long-running tasks have been pushed down, but planning, orchestration, and blueprinting stay up top. The more work the cheap models take on, the clearer the role of the expensive model becomes — because something still has to decide how that work gets divided.
So there are three numbers I’ll be watching from here. How much the open-weight spending share climbs above 14%. Whether Anthropic’s 61% floor holds. And whether the average price per token keeps falling. If open models start taking on the expensive work too, that first number will be the one to move first.
Closing
The 64% figure is real. But the question it answers is “who’s doing the most work?” “Who’s making the most money?” is a different table on the same screen. To understand the $10 trillion bet, you need to look at both tables together.
💬 What’s one task your team has shifted to a cheaper model recently, and what’s one you still trust only to the expensive model? Drop just one of each in the comments.
📨 If you know a colleague wrestling with AI costs or model choices, send this their way.
Already a subscriber? Sign in to join the conversation


References & Further Reading
Vercel AI Gateway Leaderboards
📝 Glossary
- Token: The smallest unit an AI model reads and writes text in. Most model pricing is just a per-token rate multiplied by token count.
- Open-weight model: A model whose trained weights are released publicly so anyone can download it and run it on their own servers. This differs in scope from open source, which also releases training data and code.
- Harness: A framework that wraps around a model to define how it works, what tools it uses, and what rules it follows. Files like Skill.md and soul.md, which the model reads for each task, are typical examples. We covered this in depth in Issue 82, “What on Earth Is a Harness?!”
- AI gateway: An intermediary service that lets you call models from multiple labs through a single interface. It routes requests to the right model and aggregates costs.
Footnotes
-
Vercel, “Leaderboards - AI Gateway”. https://vercel.com/ai-gateway/leaderboards/models ↩
-
Vercel, “Open-weight models take 56% of token volume, Astra doubles Fable 5.1 spend” (AI Gateway Production Index, September 2026, August data). https://vercel.com/blog/ai-gateway-production-index-september-2026 ↩ ↩2 ↩3 ↩4 ↩5
-
RuntimeWire, “Open-weight models reach 78.4% of Vercel AI Gateway token volume” (September 20, 2026). https://runtimewire.com/article/vercel-ai-gateway-open-weight-models-78-percent-token-volume ↩ ↩2
-
Vercel, “DeepSeek enters the fight for token volume, Anthropic continues to dominate spend” (June 8, 2026, May data). https://vercel.com/blog/ai-gateway-production-index-june-2026 ↩ ↩2
-
Vercel, “Open-weight models surge to 29% of volume, price per token flattens” (July 13, 2026, June data). https://vercel.com/blog/ai-gateway-production-index-july-2026 ↩ ↩2 ↩3 ↩4
-
The New Stack, “Open-weight models now handle a majority of tokens on Vercel’s AI Gateway. But Anthropic still takes 64% of the spend.” (September 2026). https://thenewstack.io/open-weight-anthropic-spend/ ↩
-
Konrad Putzier·Justin Lahart, “The AI Build-Out Is Becoming the Biggest Economic Bet in U.S. History”, The Wall Street Journal (September 23, 2026). https://www.wsj.com/economy/the-ai-build-out-is-becoming-the-biggest-economic-bet-in-u-s-history-c60716dd ↩
Related issues
Transformer Exports Hit Records, but Stocks Diverge
Exports rose 6.7% while orders jumped 51%, illustrating why trade figures and corporate earnings move at fundamentally different speeds.
BusinessHer TikTok Breakup Was Fake. So Was the Disclosure
A disclosure label costs no views, yet brands skip it anyway — and that choice reveals what they're really selling.
BusinessSolar's 42 and Mistral's 38 Used Different Rulers
Why comparing Upstage's Solar Pro 4 to Mistral Large 4 on Artificial Analysis scores falls apart under scrutiny.
Business
Your take shapes the next issue
What resonated most in this issue, or where has your experience been different?