

China AI's Smile Curve Puts Models at the Bottom
What Bank of America's chart reveals—and conceals—about who captures value in Chinese artificial intelligence.
BusinessA Chart Shaped Like a Smile
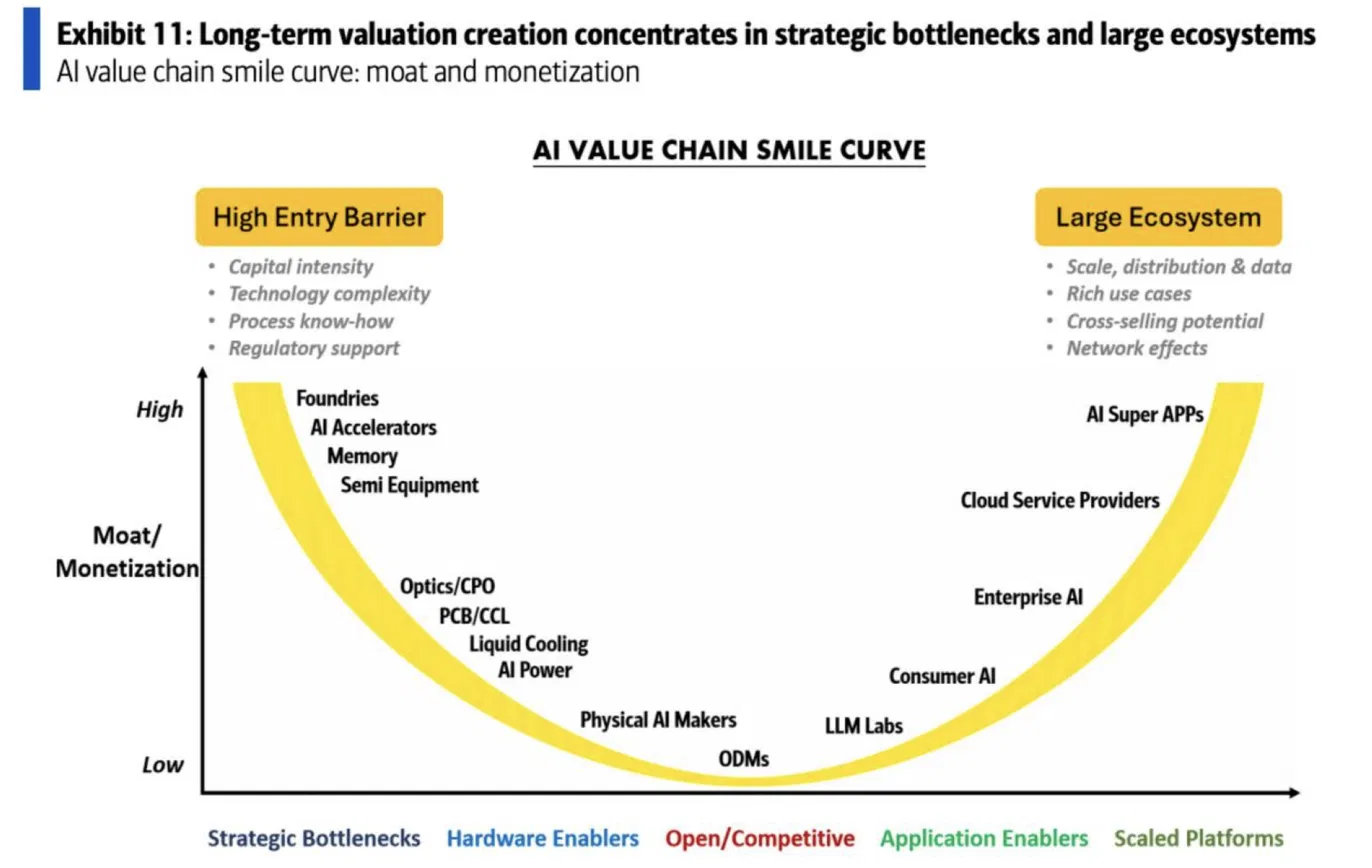
Reader, a chart from Bank of America’s (BofA) report on Chinese AI made the rounds this week. It is titled the “AI Value Chain Smile Curve”1. The vertical axis measures “moats and monetization,” while the horizontal axis tracks the stages of the value chain. Starting high on the far left, the curve dips to the floor in the middle before climbing back up on the far right. It forms the shape of a smile.
At the top left sit foundries, AI accelerators, memory, and semiconductor equipment. BofA labels this segment “strategic bottlenecks.” It is an arena defined by high capital requirements, technical complexity, process know-how, and heavy state backing. The report summary places Huawei, SMIC, and CXMT here. At the top right are cloud providers and “AI super apps.” These players command scale, distribution, data, cross-selling power, and network effects, with Alibaba Cloud singled out as the prime example.
Then comes the bottom. In the deepest trough of the curve sit ODMs2, physical AI manufacturers, and LLM labs side by side. The summary highlights two telling numbers: DeepSeek’s pricing sits at roughly 1.5% of Anthropic’s, and 70% of the robots Unitree sells still head to universities.
This piece is written based on the publicly circulated chart (Exhibit 11) and executive summary. Because I have not read the full report, I could not verify the exact benchmark comparisons behind those two figures. Operating within that constraint, let us unpack what this chart reveals—and what it leaves unsaid.
 In the original curve, R&D sat at the top
The smile curve was first drawn in 1992 by Acer founder Stan Shih to explain the personal computer industry. R&D and core components occupied the left peak, branding and services claimed the right, and assembly sat at the bottom trough. It was a diagram meant to convince Taiwanese PC makers that simple assembly left almost nothing on the table.
In BofA’s version, ODMs lingering at the bottom mirrors the original. Assembling and delivering servers yields the thinnest margins today just as it did 30 years ago. The odd placement is right next door. The very organizations spending the most on R&D—entities that belong on the high left in the classic model—are seated right beside the assembly line.
This illustrates that mastering difficult technology is entirely separate from monetizing it. Looking back at the four bullet points describing the left side of the chart, “technical complexity” is only one of them. The other three are capital, process know-how, and regulatory support. All three are conditions that take competitors a long time to match. Developing models is certainly hard, but in China, comparable models emerge every few months.
Why Models Sit at the Bottom in China
The figure putting DeepSeek’s pricing at 1.5% of Anthropic’s aligns with other data, at least directionally. This July, OpenRouter’s head of data noted that Chinese open-weight models are 60–90% cheaper than top-tier models from Anthropic or OpenAI. BofA’s 1.5% figure is far more extreme, though the summary does not specify which models or rate tiers were compared.
The gap becomes even starker when viewed through revenue. According to a Rhodium Group report published on September 17, DeepSeek’s annual recurring revenue (ARR)3 stands at $500 million. MiniMax sits at $800 million, and Moonshot at $1 billion. Zhipu disclosed an ARR of $1.8 billion in an investor meeting, according to CNBC. In the same report, OpenAI stands at $40 billion and Anthropic at $65 billion. Even combining ByteDance’s ($4 billion) and Alibaba’s ($2.4 billion) model revenues does not reach one-tenth of the two American giants.
What deserves close attention here is that in the United States, LLM labs do not sit at the bottom. Plotted along the same axis, Anthropic would sit well above the base of the curve. It would be a mistake, then, to read this chart as proof that “the AI industry inherently makes no money at the model layer.” This is a map of China.
The chart does not explain why foundation models sank to the bottom in China. From here, this is my analysis. First, once model weights are made open, anyone can sell inference services on top of them. DeepSeek does not have to be the primary provider serving DeepSeek models; in practice, cloud operators host and monetize them on their own infrastructure. The entity that builds the model and the entity collecting token fees are decoupled. Second, the platforms controlling distribution have their own models. Alibaba and ByteDance house chips, clouds, models, and consumer apps under a single roof, leaving independent labs supplying counterparts who are simultaneously customers and rivals. Third is the structural bottleneck I examined in Issue 233: Chinese research labs still have their GPUs tied up in training, meaning they simply have fewer tokens left to sell.
Yet summarizing the landscape as “every lab is locked in a price war” captures only half the story. When Moonshot released Kimi K3 in July, it benchmarked its pricing close to Anthropic’s Sonnet tier. Zhipu reported that API call volumes grew even after raising prices. A contingent of labs is now trying to charge for sheer capability. If that bet pays off, the bottom of the curve will not retain its present shape. Whether it succeeds remains to be seen.
Two words share the vertical axis
The vertical axis of this chart reads “Moat / Monetization.” While tied together with a single slash, they ask two very different questions. A moat asks whether competitors can be kept out; monetization asks whether you are actually getting paid right now.
In the top-left corner, both hold true simultaneously. Foundries and memory semiconductors have formidable barriers to entry, and they are raking in real cash today. The top-right corner is a different story. Neither the chart nor its summary provides any figures on how much the “AI Super App” at the very peak is currently earning. Just beneath it, as we saw in Issue 233, cloud providers like Alibaba Cloud post profit margins of 11–12%. A moat built on scale and distribution certainly exists, but monetization remains very much a work in progress.
The chart’s original title offers a clue: “Long-term value creation concentrates in strategic bottlenecks and mega-ecosystems.” Notice the qualifier: long-term. That means the left side of this diagram reflects present-day profit and loss, while the right leans heavily on future projections. Calling it a “curve of who actually makes money” turns the entire right half into an exaggeration. Just because both ends are drawn at the same height does not mean they share the same degree of certainty.
When the People Buying Robots Are the Ones Researching Them
Physical AI hardware makers also sit near the bottom of the curve. Humanoid shipments are climbing quickly, but according to the summary, 70% of Unitree’s sales go to universities.
What this figure signals is the underlying motive for buying. University labs do not buy robots to put them to work; they buy them to study robotics. That demand is fundamentally different from a factory bringing in hardware to replace a human worker. Academic demand expands only as far as research budgets stretch, and it stops right there. Even a steep surge in shipments is no proof that a market for “working robots” has truly arrived.
Oswarld’s Lens
The picture of models sitting at the bottom of the curve is already a familiar sight to those who buy and deploy them.
When I design enterprise implementations or AX consulting projects, I always start from the premise that “models will inevitably improve.” The same principle applies when setting up air-gapped environments for public institutions. Instead of calibrating around models available today, I architect projects anticipating where open-weight models will roughly be in 6 to 12 months. Designed this way, the model becomes a swappable component. What is genuinely difficult to rip and replace is the hardware infrastructure underneath, along with the operational workflows and data accumulated on top. As long as buyers design with this mindset, model builders will struggle to raise prices. The bottom of the smile curve is forged not merely by supplier competition, but by the architectural habits of buyers.
Plotting South Korea onto this diagram reveals an intriguing position. At the top left sits “Memory”—territory Korean companies already firmly occupy. Meanwhile, the space where we expend the most breath in the sovereign AI debate is proprietary models: the very bottom box of this chart. This is not an argument against building models. Rather, we too must answer the question China’s diagram poses: Who collects that model’s token revenue, and who controls distribution? Because South Korea has a structure where platforms like Naver and Kakao own both the platform and the model, our landscape looks closer to China’s map than America’s.
Closing
What I truly trust in this chart is the left half. The players holding the bottlenecks are making money right now, and their earnings reports prove it. The right half is projection, and the bottom reflects China’s unique circumstances. Depending on whether Moonshot and Zhipu’s pricing experiments succeed, the shape of that bottom layer could turn out quite different.
This article is not an investment recommendation for any specific stock or asset. The positions and figures in the cited BofA chart reflect BofA’s own judgment.
💬 How many times has the model your company uses changed over the past 1 year? Drop a comment and tell us what caused the biggest headache during the transition.
📨 If you have colleagues tracking Chinese AI companies, please share this issue with them.
Keep the perspective, not the noise.
We choose one consequential shift and trace what sits beneath it, every other day.
Confirm once to finish subscribing.
Already a subscriber? Sign in to join the conversation


References & Further Reading
- BofA Global Research, “Exhibit 11: Long-term valuation creation concentrates in strategic bottlenecks and large ecosystems”, 2026. ··· The chart examined in this piece. I was not able to review the full report, writing this piece based on the chart and publicly available summaries.
- Coverage of the Rhodium Group report, Futu Niuniu, 2026-09-17 ··· Source for the ARR breakdown of Chinese AI firms and their comparison to the 2 leading US players.
- Bloomberg report on Kimi K3 launch (syndicated via Yahoo Finance HK), 2026-07-17 ··· Source noting that Moonshot priced K3 on par with Anthropic’s Sonnet tier.
- The Paper, “Valuations of China’s ‘Four Little AI Dragons’ Cross 1 Trillion Yuan,” 2026-05-08 ··· Details Zhipu AI’s price hike and the subsequent surge in API call volume.
- NetEase, report on US firms adopting Chinese models, 2026-07-08 ··· Source for the 60~90% remark quoted from OpenRouter’s head of data.

📝 Glossary
Footnotes
-
Smile Curve: A concept showing that value added concentrates at both ends of the value chain (R&D and core components on one side, branding and services on the other), while dipping lowest in the middle (assembly and manufacturing). Proposed in 1992 by Acer founder Stan Shih. ↩
-
ODM: A manufacturer that handles everything from design to production for products sold under an ordering client’s brand. In AI, this primarily refers to companies that assemble and supply server hardware. ↩
-
ARR (Annual Recurring Revenue): A metric that annualizes recent monthly revenue by assuming it continues for a full 1 year. It differs from actual annual revenue. ↩
Related issues
Chip Companies Are Now Financing Their Customers
Broadcom's AI chip revenue jumped 221% year-over-year — but the bigger story is how buyers are funding all that hardware.
BusinessKB Kookmin's AI Resolved 41.3% of Calls, Staff Workload Rose
A higher AI resolution rate didn't cut one banker's call volume—it left her handling more calls, packed with harder cases.
BusinessAI Covers Take a Singer's Voice, Not Their Copyright
Korean copyright law protects only the composition behind an AI cover song—not the borrowed vocal identity.
Business
Your take shapes the next issue
What resonated most in this issue, or where has your experience been different?