

Why Childcare Cost Charts Don't Match What Parents Feel
Net childcare cost subtracts subsidies from facility fees, but that's not the whole parenting bill.
AI & TechWhy the Childcare Cost Chart Doesn’t Match What Parents Feel
The Economist ran a chart comparing childcare costs across 36 countries using OECD data. I’ve heard countless times from peers and older friends that raising kids is expensive. Yet on this chart, Korea showed up as one of the least burdened countries. That made me want to check what exactly counted as “childcare cost” here.
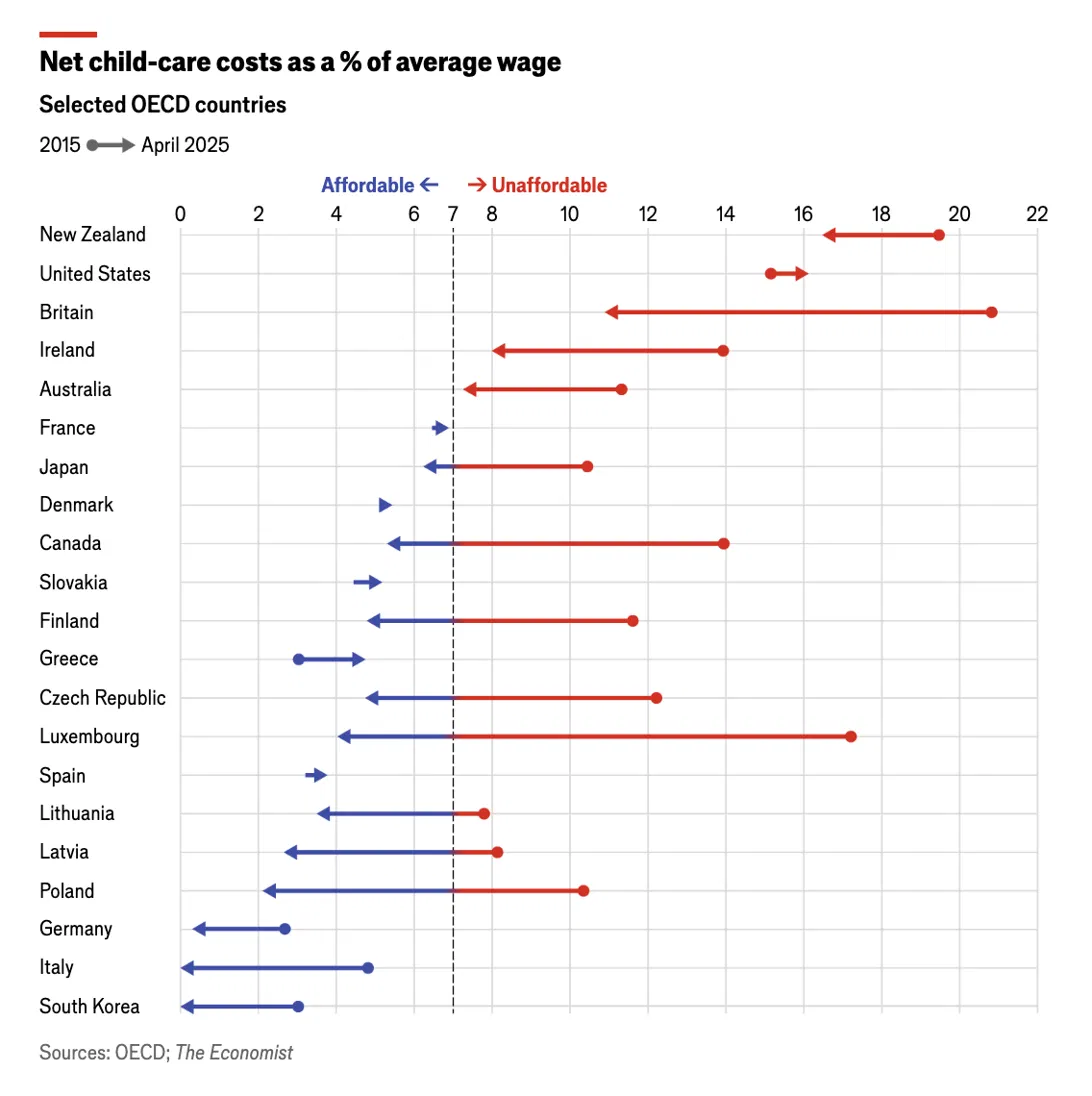
In this comparison, Korea’s net childcare cost is essentially zero. That figure assumes a fixed income and family composition, then subtracts subsidies from facility usage fees. It doesn’t mean every Korean parent spends nothing to raise a child.
So you can’t put this chart next to Korea’s low birth rate and conclude that parents’ cost burden doesn’t match reality. We need to look at the spending that never shows up in facility fees, along with the time parents spend on caregiving itself.
Net Childcare Costs, Compared Across Identical Household Types
The Economist used 7% of income as the threshold for judging whether childcare is affordable. The article assumes a dual-income household earning the average wage. The OECD’s net childcare cost calculation reflects how much the cost drops once allowances and tax breaks are applied, for a 2-year-old and a 3-year-old attending full-time care. Change the household income, the children’s ages, or the type of facility, and the results change too.
Here’s what the numbers looked like by this measure.
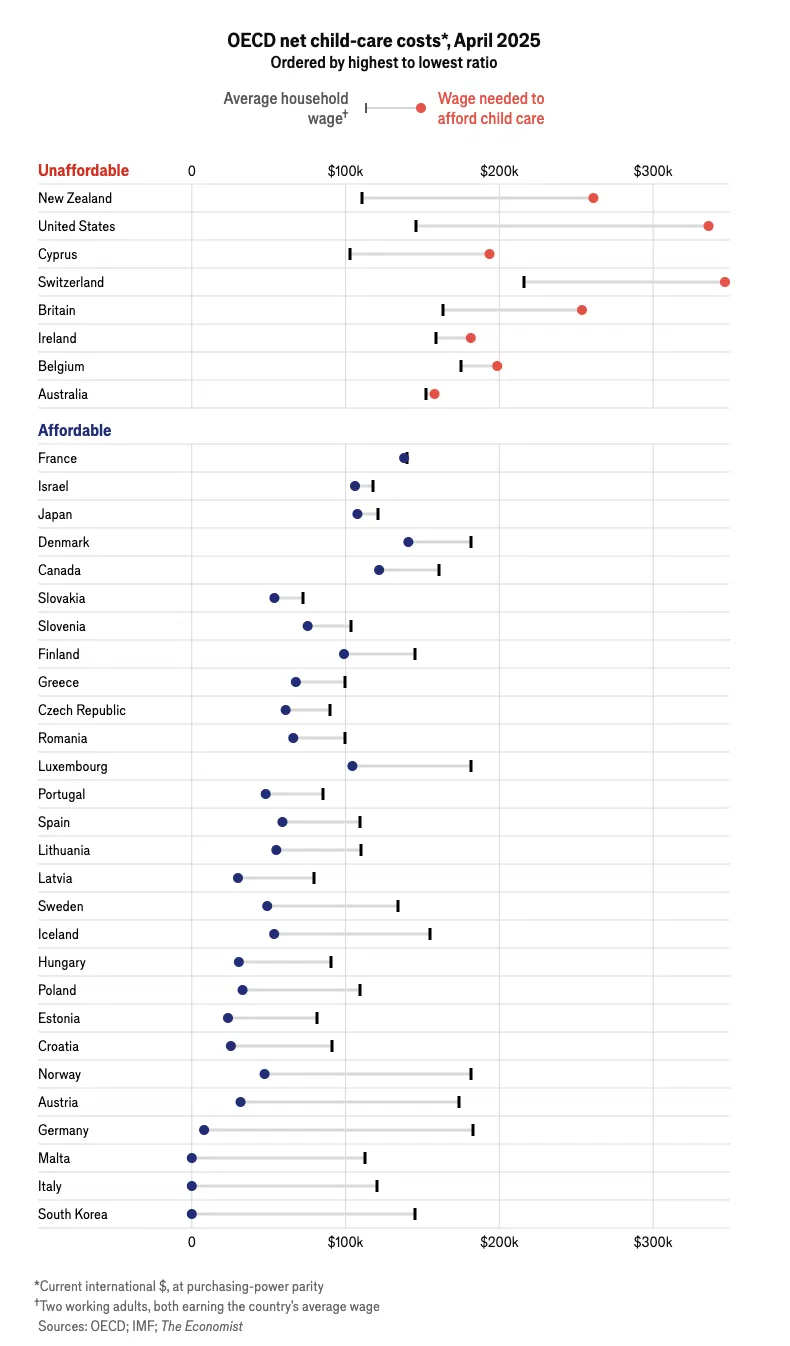
By this benchmark, 8 countries in the article exceeded the threshold, with New Zealand showing the heaviest burden. The dual-income household used for comparison earned roughly $111,000 in purchasing power parity (PPP)1 terms, and the income required to keep calculated childcare costs within 7% of income was about $261,000. This is a converted comparison figure based on current costs held fixed — not a household forecast that accounts for how subsidies shift as actual income rises. The US, Switzerland, and the UK also showed relatively high burdens. Even within a single country, support and facility availability vary by region and income level.
In the same calculation, Germany’s threshold income was about $8,010, while Korea, Italy, and Malta were presented as a group whose net childcare costs are close to zero. These are figures calculated under specific household conditions. They cannot stand in for the burden faced by low-income households, households that couldn’t secure a childcare spot, or households that hire separate caregivers.
According to the article, 30 of the 36 comparable countries saw net childcare costs fall relative to wages over the past 10 years. This reflects expanded subsidies alongside wage changes. Such support is partly a piece of pro-natal policy2, but it also serves the separate goal of helping parents work and supporting children’s care and education.
Looking at the fragment, the translation is accurate and well-structured. No Hangul remains, all numbers match, and the image/footnote counts are preserved. Just minor polish needed.
What Cost-and-Fertility Comparisons Across Countries Can (and Can’t) Tell Us
The Economist compared three countries with high childcare costs against three with low costs, finding that total fertility rate3 was higher in the high-cost group. New Zealand’s rate is about 1.6, while South Korea’s stands at 0.80 based on 2025 provisional statistics. Total fertility rate is calculated from that year’s age-specific birth rates — it’s not the actual number of children women have had over their lifetimes.
Many factors explain the differences between countries. Employment, housing, the timing of marriage, gender roles, immigration, and family composition all vary. This comparison shows that net childcare cost alone can’t fully explain fertility rates — but it isn’t causal evidence that childcare subsidies don’t work.
The effectiveness of childcare support also depends on each family’s circumstances and how the policy is designed. The OECD’s analysis of South Korea notes that family policy can help parents balance work and childrearing, but gaps remain in actual availability of care and in parental leave uptake. Fertility isn’t the only measure of policy success — whether parents can continue working, and whether children receive adequate care, matter too.
You can’t simply transplant the average cost-and-fertility combination seen in the U.S. or New Zealand onto Korean households. Even in cases like the U.K., where support systems have changed, you need to check who’s eligible, actual uptake rates, and how much time has passed since implementation before you can properly evaluate the effect.
The claim that parents hesitate to have children because of cost, and the statistic that net facility-based childcare cost is low, can both be true at once. That’s because they may be referring to different kinds of costs.
What Actually Adds Up to Korea’s Low-Birth Budget
Let me dig a bit more into the Korean case.
There’s been reporting that tallies cumulative low-birth-rate countermeasure spending from 2006 to 2023 at roughly ₩380 trillion (~$274 billion). But you have to look at what’s actually being counted. The 2025 figure of ₩88.5 trillion (~$63.9 billion) is the central government’s entire budget for responding to low birth rates and an aging society, and within that, tasks directly tied to raising birth rates account for only ₩28.6 trillion (~$20.6 billion). Dividing the total by the number of births and presenting it as “money paid per child” misrepresents what families actually receive.
Past budgets bundled in a wide range of programs — Green Smart Schools, youth entrepreneurship support, university restructuring, even culture and sports initiatives. Korea’s National Assembly Budget Office has flagged the problem of including tasks with little direct relevance or effectiveness for raising birth rates. Since each program has its own purpose and beneficiaries, they shouldn’t all be lumped together as if they were childcare subsidies or cash birth grants. Comparing OECD family-related public spending with Korea’s domestic basic-plan budget also requires aligning classification standards first.
Childcare subsidies and expanded parental allowances are policies that genuinely reduce household burden. There’s subsidized childcare for ages 0-2, and the parental allowance is paid at a baseline of ₩1,000,000 (~$720) a month for infants under 1 and ₩500,000 (~$360) a month for 1-year-olds. Because the payment method varies depending on whether a child attends daycare, you shouldn’t calculate this as though families receive both the childcare subsidy and the cash allowance separately in full. Costs beyond the basic subsidized childcare fee, and extra childcare-related spending, can still remain out of pocket.
Korea’s total fertility rate fell from 1.13 in 2006 to 0.72 in 2023, then rebounded to 0.75 in 2024 and 0.80 in 2025. Delayed and recovering marriage and childbirth patterns, shifts in the composition of the childbearing-age population, and policy changes could all be contributing factors at once. Whether the recent rebound continues remains to be seen. You can’t isolate how effective policy has actually been from just these two time series — budget and fertility rate.
In the past, Korea’s income was far lower, yet its birth rate was higher. But education, women’s employment, contraception, and family norms back then were also different from today. The fact that people had more children in the past doesn’t prove that today’s cost burdens don’t matter. I think how much people can predict about their future lives also matters a great deal in decisions about having children.
What Parents Mean by Cost Goes Beyond Facility Fees
We need to look at the burden parents describe more broadly than just facility fees.
Germany’s case is worth noting here too. It’s a country with low net childcare costs, yet in the survey cited in the article, 55% of respondents said they found it hard to afford having a child. The net-cost calculations and the responses about overall living costs aren’t measuring the same thing.
Even when facility fees are low, if parents can’t find care during the hours they actually need it, extra costs appear. They may have to cut back their working hours or leave their jobs to look after their child.
The burden parents feel includes housing costs, education costs, and the opportunity cost of career interruptions or delayed promotions. Whether they can rely on help from people around them, and how a couple divides caregiving duties, matter just as much. In a survey of 1,000 office workers by Gabjil 119 (a Korean workplace-rights advocacy group), 20.1% named mandatory parental leave for both parents as the policy most needed to address low birth rates, and 18.2% named expanded cash support. You can’t generalize from one survey’s rankings that all parents want time rather than money, but it’s worth considering that both types of burden need to be addressed together.
The quality of care matters too. Quebec, Canada introduced affordable universal childcare4 at 5 Canadian dollars a day in 1997. A study by Baker, Gruber, and Milligan for the NBER5 compared Quebec with other regions before and after the policy took effect, and found that while facility use and women’s labor supply increased, some children’s behavioral and health indicators worsened. This is the result of analyzing one specific period and policy, and it doesn’t mean free or low-cost childcare is always harmful. It shows the need to track service quality and children’s well-being alongside efforts to lower costs.
Lowering childcare costs is necessary. But it isn’t enough on its own.

Oswarld’s Lens
Having spent years building corporate strategy, I’ve seen the same pattern play out again and again.
When customer surveys say a price is too high, the reflexive move is to reach for a discount. But in the cases I’ve worked on, cutting the price sometimes did nothing to move conversion. That’s because what customers describe as a burden can actually be bundled together with inconvenience in using the product, or value that falls short of expectations. You have to look past the words in the response and pin down exactly what people are struggling to bear.
Having children isn’t the same as buying a product. But there’s a similar question worth asking: what exactly is the scope of what people call a “cost”? If more childcare subsidies still don’t make raising a child feasible because of housing, jobs, and the time demands of caregiving, those conditions need to be examined on their own terms.
When I evaluate low-birthrate budgets, I want to look past the total spend and see the burden that was actually reduced. The criteria I’d use: did housing support reach the families who needed it, can parental leave be taken without penalty, can a child be cared for until a parent gets off work. Rather than assuming these areas were simply missing from policy, we need to check why people aren’t using programs that already exist.
I’d give credit for the burden that childcare subsidies have relieved — while insisting we still need to identify, concretely, what burden remains.
Closing
The fact that Korea’s net facility-based childcare costs look low in international comparisons shows that the support system is reducing household expenses. That doesn’t mean the overall burden of raising children is low. And total low-birthrate budget spending or the birthrate alone have their limits as measures of whether any individual program succeeds or fails.
Going forward, we need to look not just at subsidy amounts but at service quality, hours of availability, and housing and employment conditions together. What matters is whether parents can actually use the support on offer.
When you were raising a child or thinking about having one, what felt like the biggest burden? Share your specific experiences in the comments — cost, time, jobs, whatever it was.
Keep the perspective, not the noise.
We choose one consequential shift and trace what sits beneath it, every other day.
Confirm once to finish subscribing.
Already a subscriber? Sign in to join the conversation


References & Further Reading
Primary sources
- The Economist, “Child care is becoming more affordable”, June 2026. : This is today’s core data source — a comparison of child care costs across 36 countries using OECD data. Be sure to check the underlying assumptions on income and family composition.
- Baker, M., Gruber, J., & Milligan, K., “Universal Childcare, Maternal Labor Supply, and Family Well-Being”, NBER Working Paper No. 11832, 2005. : A study analyzing the effects of Quebec’s universal childcare program on child development. It’s essential reading for understanding the unintended consequences of expanding child care access.
Background
-
OECD analysis of Korea’s family policy, March 5, 2025.
-
Government announcement of the 2025 Low Fertility and Aging Society implementation plan, July 4, 2025.
-
2025 preliminary birth and death statistics, February 25, 2026.
-
Ilyo Sinmun (a Korean weekly newspaper), “₩380 trillion (~$274.6B) spent, 0.72 births to show for it — where did the low-birthrate budget go?”, April 2024. : An analysis of how Korea’s low-birthrate budget is structured and actually spent — useful for seeing what projects the headline total really covers.
-
CNN, “Population crisis: South Korea is finally having more babies but can it last?”, February 2026. : Expert analysis of what’s behind Korea’s fertility rebound and its limits.
-
Asia Economy, “₩88.5 trillion (~$64B) low-fertility budget finalized — policy effectiveness reviews to begin in earnest”, July 2025. : A summary of how the 2025 low-fertility budget was composed and the debate over restructuring it.

Footnotes
-
PPP (Purchasing Power Parity): A method of adjusting currency values to reflect price levels across countries. If a Big Mac costs ₩5,000 (~$3.6) in Korea and $5 in the US, this implies an exchange rate of $1 = ₩1,000 for comparison purposes. It gives a more accurate picture of actual living standards than a simple exchange rate does. ↩
-
Pro-natalist policy: A general term for government policies aimed at raising the birth rate, including child care subsidies, birth grants, expanded parental leave, and housing support. ↩
-
Total Fertility Rate (TFR): The number of children a woman would have over her lifetime if current age-specific birth rates held steady throughout her childbearing years (ages 15–49). A population needs a TFR of roughly 2.1 to sustain itself naturally; Korea’s rate of 0.80 is less than half that threshold. ↩
-
Universal childcare: A system that provides child care services to all families regardless of income. Quebec launched its program in 1997 at CAD $5 a day; it became hugely popular politically, but debate over its effects on child development continues. ↩
-
NBER (National Bureau of Economic Research): A private, nonprofit American economic research institution. It is globally authoritative on business-cycle dating and economic policy research, and has produced numerous Nobel laureates in economics. ↩
Related issues
How Android Phones Warn You Before an Earthquake Hits
Phone sensors detect quakes already underway and alert users seconds before the strong shaking arrives.
AI & TechEY, KPMG, Deloitte Reports Hit by Fake Citations
Independent audits found many hallucinated or garbled citations in three Big Four AI reports, raising questions about verification.
AI & TechGoogle Applies to Release 64 Million Mosquitoes in the US
Google filed a US permit to release up to 64 million male mosquitoes over two years, using Wolbachia-based sterile insect technology.
AI & Tech
Your take shapes the next issue
What resonated most in this issue, or where has your experience been different?