

Newspaper Stocks Fell Years Before Profits Did
A 2002-2007 newspaper stock chart shows how investors can price in a decline long before earnings confirm it.
BusinessStock Prices Fell Before Earnings Did
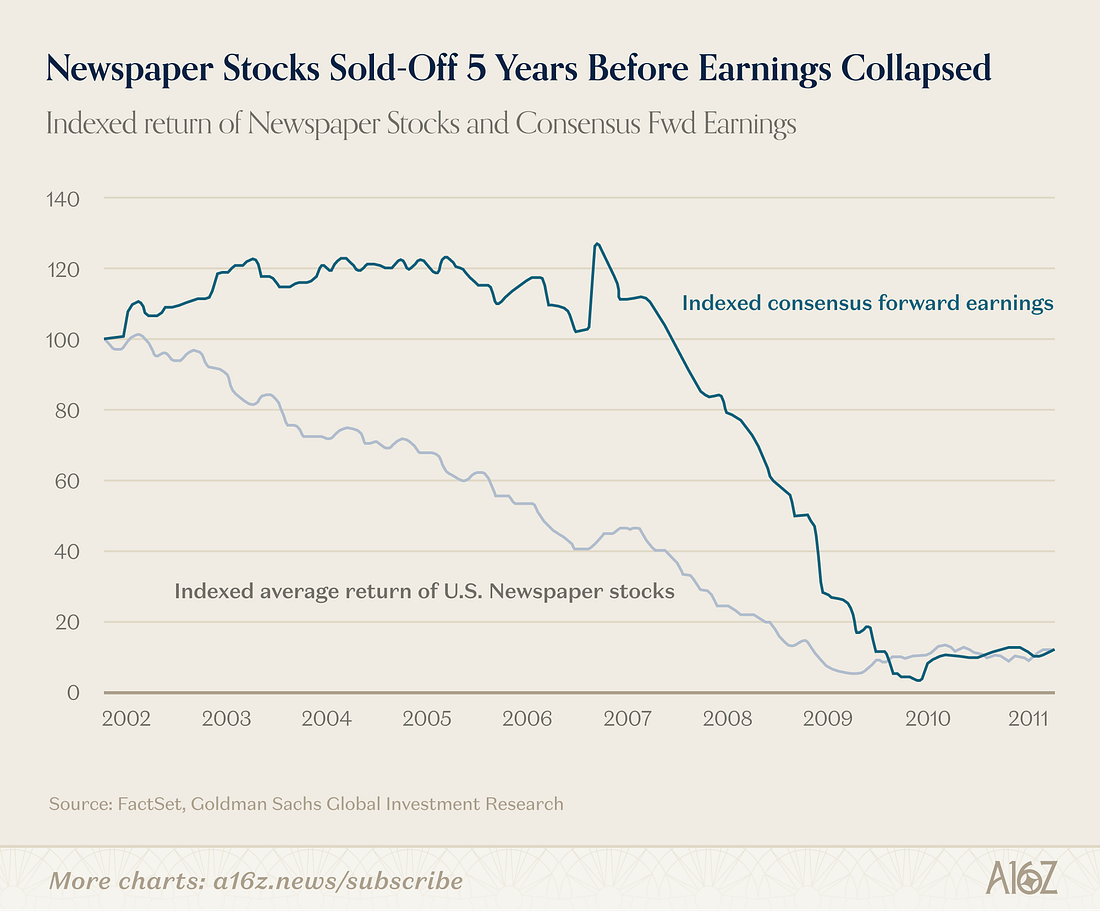
A chart of U.S. newspaper stocks that a16z put together shows a striking lag between share prices and earnings forecasts.
In the chart, stock prices started falling in 2002, but earnings forecasts didn’t deteriorate sharply until around 2007. It’s a case of investors marking down a business’s future well before the numbers confirmed it.
 [Chart 1: Newspaper Stocks Sold-Off 5 Years Before Earnings Collapsed]
The same story is circulating in software stocks right now. The logic goes: “Earnings still look fine, but AI will eventually gut SaaS — we should sell now, the way investors should have sold newspaper stocks back then.” Sure enough, the forward-12-month free-cash-flow multiple1 for software companies has dropped to its lowest level since 2014.
Can we really treat AI’s spread as the same kind of process as the newspaper industry’s decline? There’s also data showing AI usage is climbing. We need to look at how much demand grows as the cost of using AI falls, and who actually captures that demand as revenue.
The English draft matches the Korean source accurately with no distortions, omissions, or glossary violations. Here is the fragment as-is:
Software stocks aren’t all moving the same way
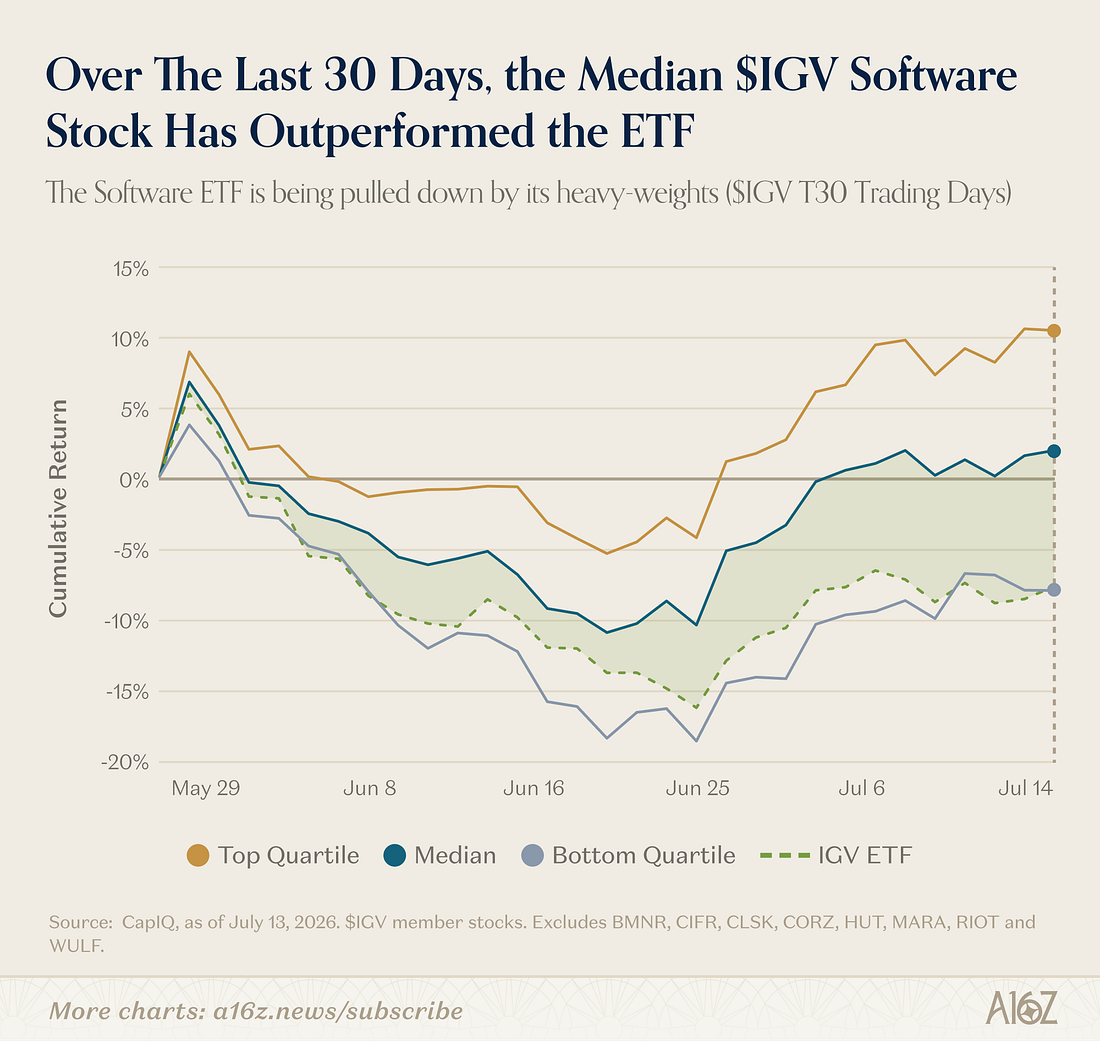
Lumping the software sector’s decline into one story makes it easy to miss the differences between individual stocks. a16z’s analysis split the constituents of a US software ETF into groups by return, then compared them.
 [Chart 2: Software’s Selective Sell-Off, $IGV returns by quartile]
If you split the constituents of IGV2, a US software ETF, into four groups by return, the top and bottom groups moved roughly in sync until the start of the year. But starting in January 2026, they began to diverge, and now there’s a gap of about 50 percentage points between the top and bottom quartiles. The top quartile is actually posting positive returns.
What’s interesting is that this gap has almost nothing to do with revenue growth rate. Large-cap companies with high growth rates are sometimes clustered in the bottom quartile. a16z interprets this as investors evaluating not just current growth but whether a company’s competitive edge will hold up in the AI era. In the sample analyzed, software companies specializing in security, systems monitoring, or specific industries fared relatively well, while general-purpose platforms and tools were weaker. Stock performance doesn’t settle the question of any given company’s survival.
The interpretation is that simply being able to build software is no longer enough to sustain a competitive edge. The falling cost of using AI, which makes it easier for new competitors to enter, is another factor worth weighing.
The company whose revenue jumped 85% declared “subscriptions are dead” · Issue No. 147 · INLEVEL9 LetterIn an era when software finishes the job for you, pricing itself is changingThe Cost of AI Fell Faster Than the PC Did
 [Chart 3: The Price of Intelligence Is Falling Quickly]
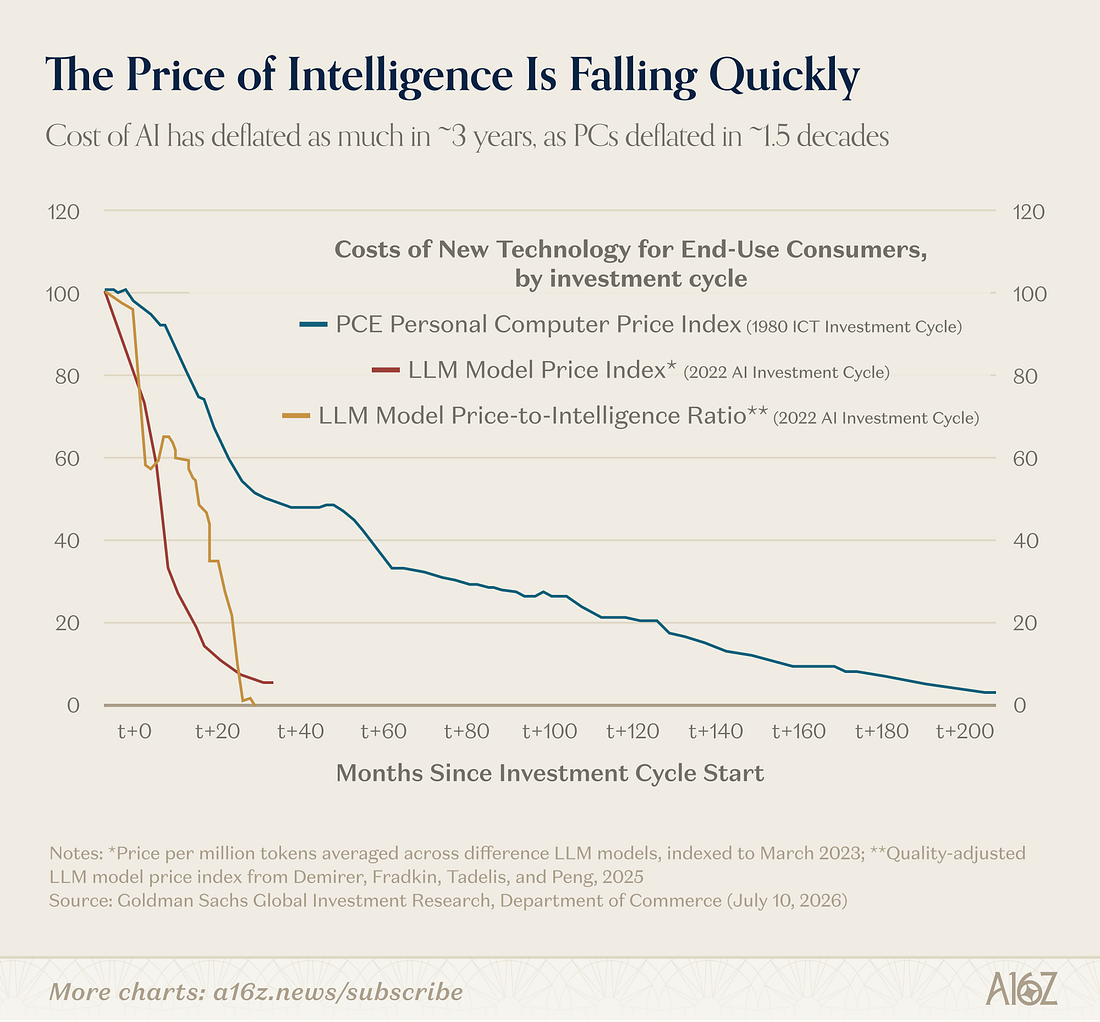
This chart, requoted from Goldman Sachs data, compares the price-index trajectory of PCs since the 1980s with that of AI since 2022. The decline that took PCs more than 15 years to achieve, LLMs managed in roughly 3 years. That said, these are quality-adjusted indices comparing different kinds of products, so it’s not a strict law that all AI prices fall exactly five times faster than PC prices did. What the chart does show is a clear trend: the cost of using AI, measured per token3, has been dropping fast.
Two readings diverge here. The pessimistic one goes: “Frontier models keep getting more expensive to build, while customers have less and less reason to insist on the latest one. If everyone migrates down to cheaper legacy models or open-weight models4, frontier development becomes unsustainable.”
The optimistic one sees it differently. As prices fall, the range of viable use cases expands, and the resulting growth in usage can outpace the decline in unit cost. This is the same pattern the 19th-century economist Jevons observed in coal — the Jevons Paradox5.
I touched on this paradox once before, in Issue 2. That piece was about individual work: each task gets faster with AI, but total workload keeps expanding, so nobody actually clocks out earlier — a structure that researchers at UC Berkeley termed “work intensification.” Today I want to widen the same paradox to the level of the entire market: to check whether what showed up in individual AI usage also shows up in household and corporate spending data.
The English draft looks accurate and complete. No corrections needed.
Prices are falling, but household spending and token usage keep rising
 [Chart 4: US household AI paid subscription penetration rate and average monthly spend]
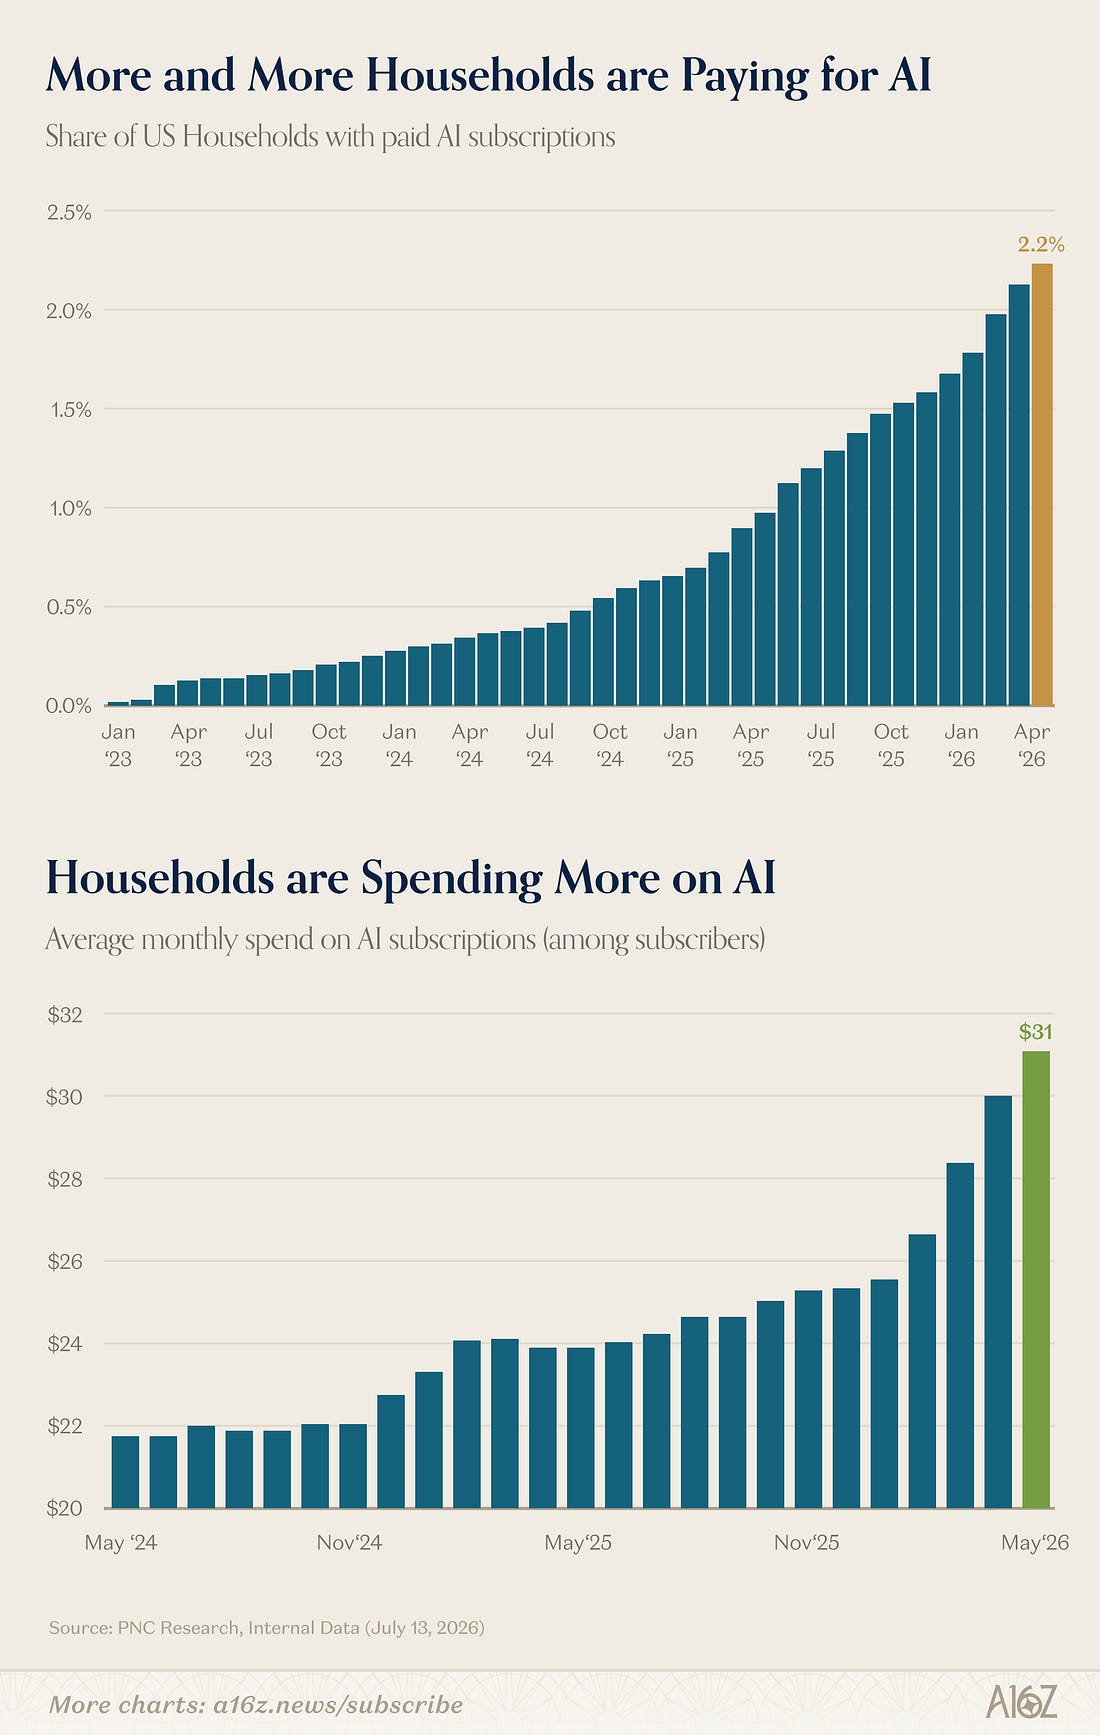
In the PNC Bank payment-data sample cited by a16z, the share of US households with a paid AI subscription stood at 2.2% as of April 2026. That’s still a small absolute number, but it’s climbed steadily over the period shown. What’s more striking is the average monthly spend among subscribing households, which rose about 25% since the start of the year to $31. Paying subscribers are also spending more. That said, the per-token price of an API and the flat subscription fee households pay are different kinds of prices, so they can’t be directly swapped for comparison.
YipitData’s analysis of OpenRouter usage data also shows rising usage. The token share of Asia-based providers roughly tripled since the start of the year, to 60%. The original source treats this as a proxy indicator of the spread of open-weight alternatives. Frontier model usage also grew over the same period, and per-user token consumption grew faster than per-user spend. This is a result from the OpenRouter sample. A shift in demand toward cheaper models and an overall rise in usage can happen at the same time, and this shouldn’t be read as representative of the AI market as a whole.
There’s one historical figure worth keeping in mind here. Even in 1997, decades after enterprise computers had become commercially standard, PC ownership among US adults aged 35–54 was only around 45%. Current comparison figures put household PC ownership at about 90%, and about 97% once smartphones are included. Because we’re comparing individuals with households, and paid subscriptions with device ownership, penetration rates here shouldn’t be read on the same scale. Technology adoption unfolds slowly, over a long stretch of time, shaped by utility and price. A 2.2% penetration rate looks less like a ceiling already reached and more like an early stage.
But there’s one thing I should honestly flag here. The research team that built the quality-adjusted price index in Chart 3 actually reached a more cautious conclusion in the same paper. When Demirer’s team measured short-run price elasticity6, it came in just above 1, leading them to write that “there is limited room for a Jevons paradox to operate.” In other words, within the range they measured, the usage increase from falling prices wasn’t enough to substantially raise total spending. It’s hard to take an elasticity estimated from small price changes and apply it directly to a case where the price falls by half.
So where is the rise in total spending coming from? I think this is the crux of the debate. Existing users spending more (the intensive margin) and new users continually joining (the extensive margin) are two different stories. What the research team measured is the former, while the growing share of paid-subscriber households relates to the latter. It’s likely that the spending growth we’ve seen so far owes more to new user inflow than to a Jevons effect.
Oswarld’s Lens
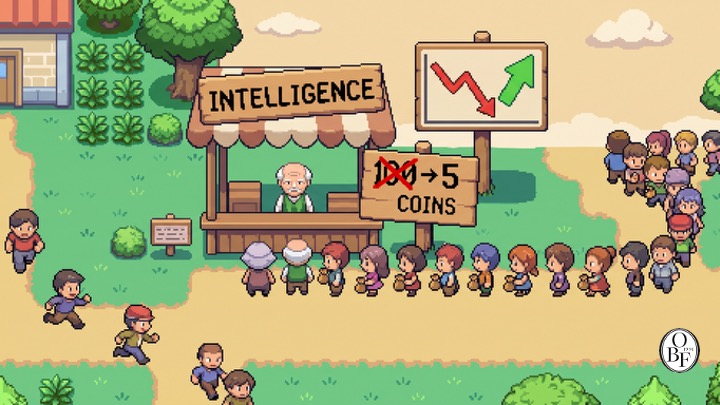
Looking at these charts together, I found myself thinking about how falling AI usage costs might reshape competitive dynamics and demand. That said, stock prices and household spending shifts can’t be traced to a single cause. From a company’s standpoint, I think the real question is whether you’ve built customer relationships and domain knowledge that competitors can’t easily replicate, in a world where cheap AI is available to everyone.
From my experience building go-to-market strategies, the most common mistake companies make when a new technology’s unit cost collapses is reading falling prices as a shrinking market. Lower prices can just as easily expand the market — opening it up to use cases and customer segments that were previously priced out. I saw the same pattern helping SaaS products break into new markets. The customers who came in after the price barrier dropped ended up generating most of the revenue.
Still, the lesson from the newspaper charts holds. Sometimes the market is right to start selling five years before earnings actually collapse. But in the newspaper industry’s case, readers and ad demand migrated to other media entirely, whereas software demand itself is growing right now. Even as overall demand grows, demand for existing products can shrink while other companies capture it. So I don’t see this moment as the end of the software industry — I see it as demand shifting toward a different set of companies.
Closing
I came across data showing that as the cost of using AI dropped, paid subscriptions and usage both rose in tandem. But we shouldn’t read that as proof that falling prices guarantee growth for the market as a whole. We need to look closely at exactly which customers are newly coming in, and which products are seeing demand shift toward them.
The question that matters to me is this: as more competitors gain easy access to AI, what kind of differentiation can my product actually hold onto? It connects to the question of durable competitive advantage that Peter Thiel raises in Zero to One. I was genuinely startled recently to see a service called same.new in a Y Combinator batch. You feed it a URL, and it recreates the design and rough functionality of that website. It raised real concerns for me about how existing creators’ rights get respected — and watching a product like this attract investment and support made me rethink what differentiation a company actually needs to protect.
same.newHas your AI subscription spending gone up or down compared to a year ago? Tell us in the comments — what are you spending more on, and what have you cut?
📨 If you found this analysis useful, please share it with a colleague
Keep the perspective, not the noise.
We choose one consequential shift and trace what sits beneath it, every other day.
Confirm once to finish subscribing.
Already a subscriber? Sign in to join the conversation


References & Further Reading
Primary sources
- Moses Sternstein, “Charts of the Week: Software’s Selective Sell-Off”, a16z New Media (Random Walk), 2026. 7. 17. ··· This is the piece that forms the backbone of today’s newsletter. All four charts originate here.
- Goldman Sachs Global Investment Research, “Costs of New Technology for End-Use Consumers”, 2026. 7. 10. ··· The key evidence directly comparing the price-decline cycles of PCs and LLMs. It’s paid research with no public link, but you can see the chart in the article above.
- PNC Research, Internal Data, 2026. 7. 13. ··· The source for the data on U.S. households’ paid AI subscription penetration rate (2.2%) and average monthly spend ($31). It’s internal bank payment data, so the raw figures aren’t public.
- YipitData’s OpenRouter token usage analysis, 2026. ··· Data showing both the expansion of open-weight model share and the growth in total consumption together. Keep in mind that the OpenRouter sample may skew toward users of lower-cost models.
Counterevidence (worth reading alongside)
- Mert Demirer, Andrey Fradkin, Nadav Tadelis, Sida Peng, “The Emerging Market for Intelligence: Pricing, Supply, and Demand for LLMs”, NBER Working Paper 34608, 2025. 12. ··· This is the very research team that built the quality-adjusted price index in Chart 3. Yet the paper’s fifth finding is that the short-run price elasticity barely exceeds 1, leaving “limited room for a Jevons paradox.” That conclusion runs head-on into today’s argument, so I’d recommend reading it alongside Chapter 3 of the main text. The full PDF is also available.
Background
- William Stanley Jevons, The Coal Question, 1865. ··· The original source of the paradox — that efficiency gains increase consumption rather than reduce it. The full text is available free on Econlib.
- U.S. Bureau of Labor Statistics, “Computer Ownership Up Sharply in the 1990s”. ··· The source for the 45% PC ownership rate among adults aged 35-54 in 1997.
- Digitunity, “The United States Computer Ownership Gap Persists”. ··· The data on today’s roughly 90% computer ownership rate among U.S. households.
Past issues worth reading alongside this one
- Issue 2: The Structural Reason AI Doesn’t Reduce Work — What Coal 160 Years Ago Has in Common with Prompts in 2025 ··· This issue unpacked the same Jevons paradox discussed today, but from the angle of individual workloads and burnout. Read it alongside today’s market data and the picture comes together.

Footnotes
-
Multiple: A ratio showing how many times a company’s earnings or cash flow the market values it at. A lower multiple means the market is paying less for the same earnings than it used to. ↩
-
IGV: A leading ETF that bundles U.S. software companies (iShares Expanded Tech-Software Sector ETF). It lets you track sector trends through the price movements of its constituent stocks. ↩
-
Token: The smallest unit an AI model uses to process text — roughly one to two Korean characters, or part of an English word. AI usage fees are typically charged per token. ↩
-
Open-weight model: An AI model whose trained parameters (weights) are made public, so anyone can download and use it. Usage terms depend on the license, and running it yourself isn’t always cheaper than a commercial API. ↩
-
Jevons paradox: The counterintuitive phenomenon where improved efficiency in resource use, instead of reducing consumption, actually increases total consumption — because falling prices open up new use cases. First observed with coal in 19th-century Britain. ↩
-
Price elasticity: A figure showing how much demand rises when price falls by 1%. Total spending only increases if this value is comfortably above 1. Near 1, usage rises just enough to offset the price cut, leaving total spend roughly unchanged. ↩
Related issues
AI Made Tasks Faster. So Why Am I Still Working Late?
AI can save time on one task while quietly adding new work elsewhere—here's what the Jevons paradox and recent studies suggest you track.
BusinessEU Levies €3 Per Item Type on Small Parcels
From shirts to sunglasses, each item category adds €3 — here's how the math works and what it means for Temu and Shein.
BusinessWhy Palantir Declared 'SaaS Is Dead' After 85% Growth
Palantir's blunt claim points to a deeper shift from seat-based subscriptions toward outcome-based software pricing.
Business
Your take shapes the next issue
What resonated most in this issue, or where has your experience been different?