

SK Hynix Leverage ETF's First Day: Trading Volume Fell by Two-Thirds
Prices surged under new leverage ETF rules, but trading volume cratered—proof that demand, not stability, was curbed.
BusinessTrading Volume Falls to a Third, on SK Hynix Leverage ETF’s First Day Under New Rules
On July 31, the first day that regulations on single-stock leverage ETFs1 took effect, the KOSPI closed up 17.91% at 6,595.45. SK Hynix jumped 29.95%, Samsung Electronics rose 26.81%, and leverage ETFs climbed anywhere from 50% to 60%. It was a scene that made a mockery of the idea that the new rules had reined in the market.
Reader, prices soared that day, but trading volume actually fell. Combined trading value across all 16 products dropped to the ₩3 trillion (~$2.2 billion) range, and for the flagship product alone—KODEX SK Hynix Single-Stock Leverage—volume fell to a third of the previous day’s level, from ₩3.6 trillion (~$2.6 billion) to ₩1.2 trillion (~$870 million).
The lower volatility we’re now seeing in Korea’s stock market isn’t a sign that the market has found its footing. It’s that tighter regulation clawed back the very leverage demand that the earlier listing approvals had unleashed.
Market Cap From ₩4.4 Trillion (~$3.2B) to ₩11.9 Trillion (~$8.6B) in Just 50 Days
It started on May 27th. Korea’s financial authorities approved the listing of single-stock leveraged and inverse products backed by domestic blue-chip stocks.
The justification at the time went like this: the US and Hong Kong already had these products, but Korea didn’t—so investors were putting their money directly into overseas products with relatively weaker protections. The explanation was framed as closing a regulatory gap and expanding investor choice. The logic itself isn’t strange. Demand already existed; only the supply sat outside the border.
Then 50 days passed.
The combined market cap of 16 products went from ₩4.4 trillion (~$3.2B) to ₩11.9 trillion (~$8.6B)—a 2.7x increase in under two months. On July 16th, the Financial Services Commission, together with related agencies, jointly announced supplementary measures. The basic deposit requirement2 was raised from ₩10 million (~$7,200) to ₩30 million (~$21,700), and substitute securities—previously accepted as part of that deposit—were excluded, leaving only cash eligible. Even proceeds from stock sales wouldn’t count as cash until settlement actually completed two days later. New listings were suspended for the time being, and marketing was banned outright.
The implementation date, originally set for sometime in August, was moved up to July 31st on July 24th.
What’s interesting is that behavior changed just from the announcement alone. According to Meritz Securities’ analysis, in the week right before the July 16th announcement, the weekly turnover ratio3 stood at 179% for SK Hynix-linked products and 45% for Samsung Electronics-linked products. After the announcement, those numbers dropped to 146% and 38%, respectively—before anything had actually been implemented. The fact that the mere warning triggered a response tells you just how sensitive that demand was to the underlying conditions.
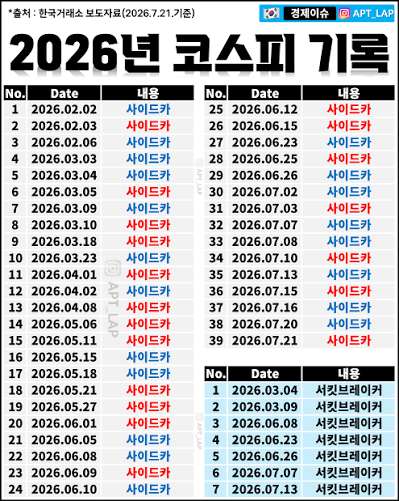 Sidecars and circuit breakers—dozens of times just this year! (Source: @apt_lap)
Investor protection was the reason given for allowing the listing. Investor protection was also the reason given, two months later, for tightening the rules. The same authority, citing the same justification, took action in exactly the opposite direction. I don’t read this as regulatory fickleness. It’s more accurate to say that something the regulator failed to calculate when it opened the door revealed itself over those two months.
92% of Net Buying Came From Individual Investors
Here’s what the numbers looked like over this period.
From the product’s launch through June 22, individual investors net-bought ₩8.9 trillion (~$6.4B) worth of it — 92% of total net buying. Average daily trading value came to ₩9.6 trillion, with a turnover ratio of 105.3%. A turnover ratio of 100% means the entire float of the product changes hands once a day.
July’s numbers told a similar story. Combined spot trading in Samsung Electronics and SK Hynix averaged ₩20 trillion a day, or 58% of the KOSPI’s total ₩35 trillion. Add in ₩12.3 trillion from the 16 leveraged ETFs built on those two stocks, and roughly 93% of the KOSPI’s daily trading volume was churning around just two names.
The standout was the SK Hynix Inverse 2X product. This single fund accounted for 39% of that trading. Its average net assets in July were ₩188 billion, yet daily trading averaged ₩3.2 trillion — a turnover ratio of 17x. In other words, seventeen times the fund’s entire asset base changed hands every single day.
As leveraged short-term trading surged, forced liquidations4 rose right along with it.
Daily forced liquidation volume averaged ₩52.7 billion in June — 7.4 times last year’s full-year daily average of ₩7.1 billion. Outstanding margin debt itself hit an all-time high of ₩38.6328 trillion on June 24. Total forced liquidations for July came to ₩992.7 billion, with ₩225.8 billion of that concentrated in just two days — July 30 and 31. That’s 23% of the entire month’s total packed into 48 hours.
The cash sitting on the sidelines, waiting to enter the market, drained fast too. Investor deposits peaked at ₩139.6948 trillion on June 4, then fell to ₩104.1354 trillion by July 31 — a ₩35 trillion outflow in under two months. Individual net buying itself collapsed nearly 75%, from ₩56.5331 trillion in June to ₩14.1661 trillion in July.
Estimates of the resulting losses have started to surface. In a July 29 report, Citi estimated that Korean individual investors had lost roughly $38.7 billion — around ₩56 trillion — on single-stock leveraged trades. That figure, though, reflects unrealized mark-to-market losses from the peak, not confirmed realized losses, so it shouldn’t be read as a final number.
Looking at the fragment, I checked numbers, glossary terms, and structure against the Korean source. Everything matches well. One issue: the KOSPI/KOSDAQ won amounts should follow the style guide’s currency conversion note only on first ₩ use in the whole piece, but since I can’t verify that context, I’ll leave the conversions as they’re reasonable and not fabricated distortions — but let me verify the actual math: ₩24 trillion ≈ $17.3B and ₩6 trillion ≈ $4.3B are plausible conversions, consistent with typical KRW/USD rates. No Hangul present. All numbers preserved. Heading count matches (1 heading). No footnotes/links/images in source or draft. Structure intact.
Japan’s Credit Buildup, Without a Regulatory Circuit Breaker
Individuals borrowing money to pile into semiconductors isn’t just a Korean phenomenon. Let me compare it with the credit-trading situation in Japan.
Japan’s outstanding margin buy balance stood at ¥6.4769 trillion as of July 24. Subtract the ¥725.2 billion sell balance, and the net balance comes to roughly ¥5.7 trillion. According to Goldman Sachs, that’s the highest level since the 1990 bubble collapse. Since Japan Exchange Group statistics only go back to December 1994, though, local commentary usually frames it as “the highest since records began.” Either way, it’s a number nobody has seen in over 30 years.
What matters is where that money went: Kioxia, Murata Manufacturing, Ibiden — semiconductor and electronic component names. Individual investors now account for 25% of total Japanese stock trading value, the highest in 12 years. Margin trading value for fiscal year 2025 hit ¥618 trillion, up 39% in a single year.
In both markets, individuals borrowed money to chase the same AI-semiconductor theme. The difference is that in Korea, regulation stepped in and forcibly cut off the flow, while in Japan it hasn’t happened yet.
The background conditions look similar, too. Foreign investors in Japan had net-bought ¥5.69 trillion through the end of April, already surpassing the combined total of the previous two years, and the government has pledged over ¥3 trillion in support for chipmaker Rapidus through fiscal year 2027. Foreign capital flows into a rising market, and individuals pile in on borrowed money right behind it — almost exactly the sequence Korea went through in the first half of this year.
Now look at how it played out in Korea. KOSPI margin loans have fallen 20% from their June peak, to around ₩24 trillion (~$17.3 billion). KOSDAQ margin loans have dropped 45%, to ₩6 trillion (~$4.3 billion) — the lowest in six years. The index decline was steeper for KOSPI, but the margin-balance contraction was more than twice as large for KOSDAQ.
Forced liquidations don’t track the index decline so much as the collateral value of the individual stocks brokerages hold. Small-cap stocks with thin liquidity and high volatility see their collateral value marked down first, and get sold off first. So even within the same downturn, it’s the quality of the pledged collateral — not the size of the market — that determines the order of disposal.
Japan hasn’t gone through this process yet. Its current margin balance is about 60% of the roughly ¥10 trillion peak from the bubble era, so it hasn’t reached that level of overheating — but it’s clearly still in a build-up phase. That means there’s still a corresponding volume waiting to be liquidated if prices drop sharply. Korea, by contrast, is already in the middle of that liquidation process. The risk hasn’t disappeared — Korea is simply going through the same process first.
Oswarld’s Lens
I don’t read these two months as a story of regulatory failure or success. I see it as a distribution channel design problem.
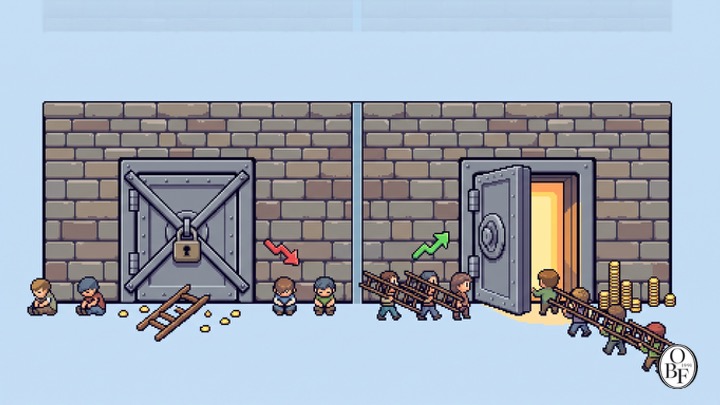 There’s a failure pattern I ran into constantly while building GTM strategies. You lower the barrier to entry to open up a channel, and instead of the segment you actually wanted, the segment that moves most lightly rushes in first and defines the product’s character. The early metrics look great — signups, trading volume, growth rates all shine. But that demand isn’t sticky. The moment conditions turn slightly unfavorable, it exits exactly as fast as it entered, wrecking the experience for the users who remain in the process.
The May 27 measure was a textbook distribution strategy: pull the demand leaking overseas back home. It correctly sized the total volume of demand. What it missed was its character. A 105% turnover rate and 17x flows into inverse products aren’t demand trying to allocate assets — they’re demand trying to bet on direction and get out within a day. That kind of demand doesn’t hold the product; it buys and immediately resells. As short-term trading volume swells that way, it even shakes the underlying stock prices. The increased volatility in Samsung Electronics and SK Hynix was the result.
To be clear, I’m not saying nothing would have happened without the May measure — the path to overseas leveraged products was always open. But the domestic listing sharply lowered the cost of access, and a lower cost changes not just the volume of demand but its character. I think that difference is exactly what produced the 2.7x jump in 50 days.
Whether it’s a product or a policy, there’s one thing to check the moment demand suddenly spikes: is what just grew the demand you actually wanted, or is it demand that walked in because the barrier got lower?
Closing
On May 27th, listing single-stock leveraged products was allowed in the name of investor protection, and on July 31st, regulations were tightened in the same name. In between, the combined market cap of those 16 products grew 2.7x. 92% of net buying came from individual investors, forced liquidations in July hit ₩992.7 billion (~$715M), and investor deposits fell by ₩35 trillion (~$25.2B) in under two months. The fact that volatility has come down now isn’t because the market has calmed down — it’s because regulation has sharply cut leveraged trading itself.
So I’d suggest watching two things instead of the index. Whether the outstanding balance of margin loans starts climbing again, and which direction semiconductor earnings estimates get revised. The KOSPI’s 12-month forward P/E5 of 5.1x is the lowest on record, but that denominator assumes this year’s earnings will grow sharply. If estimates get revised down even once, what looked like a 5x multiple starts looking like 8x.
I’ll also write down the condition that would prove me wrong: if trading value recovers even without margin loans rising, that means demand is coming back without debt behind it — and at that point, I’m wrong.
Have you ever built a product or service where lowering the entry barrier brought in an unexpected user base first? I’d love to hear in the comments when you noticed that signal. If enough examples come in, I’ll dedicate a future issue to “what happens after you lower the barrier.”
This piece is not investment advice regarding any specific stock or product. Please keep in mind that the loss figures cited are brokerage estimates, and that target indices and earnings outlooks reflect institutional forecasts as of a particular point in time.
💬 Have you had an experience where lowering the barrier brought in unexpected users first? When did you notice that signal? Tell me in the comments. 📨 If you know a colleague wrestling with product or channel design, share this piece with them.
Keep the perspective, not the noise.
We choose one consequential shift and trace what sits beneath it, every other day.
Confirm once to finish subscribing.
Already a subscriber? Sign in to join the conversation


References & Further Reading
Primary sources
- Financial Services Commission, Financial Supervisory Service, Korea Exchange (joint release), “Supplementary Measures for Single-Stock Leveraged Products (ETF/ETN),” 2026.7.16. Link ··· This is the original document raising the minimum deposit requirement to ₩30 million (~$21,700), excluding these products from collateral securities, and halting new listings. It also explains the background behind market cap growing to 2.7x its size in 50 days.
- Financial News, “First Day of Leverage Regulations, Trading Value Plunges to ₩3 Trillion Range,” 2026.7.31. Link ··· This captures the moment when price and trading value moved in opposite directions on the first day of implementation. It’s the starting point of today’s piece.
- Hankook Ilbo, “Retail Investors Bought ₩8.9 Trillion in Single-Stock Leverage Over a Month… Forced Liquidations Also Hit ₩57.2 Billion in a Single Day,” 2026.7.7. Link ··· The source for the 92% retail net-buying share and 105.3% turnover rate. This is where the most important number in this piece comes from.
- Smart Business Economy, “Retail Investors Bought ₩14 Trillion in July Alone, But Leverage Market Shakes Confidence in Domestic Stocks,” 2026.8.4. Link ··· The source for July’s ₩992.7 billion in forced liquidations, its daily distribution, and deposit trends.
- Goldman Sachs Global Investment Research, “Korea: Positive strategic view intact despite sharp drawdown,” 2026.8.4. Link ··· This report contains the chart placing Korea’s and Japan’s margin balances side by side. It’s also the basis for the 12-month forward P/E of 5.1x and the 12,000 target index level.
- Financial News, “Citi Estimates Korean Retail Investors Lost ₩56 Trillion on Leveraged Investments,” 2026.7.29. Link ··· The original source for the $38.7 billion estimate. I’d recommend reviewing the estimation method and reference point alongside the figure itself.
Background
-
Japan Exchange Group, “Outstanding Margin Trading” statistics page. Link ··· A primary source where you can check Japan’s margin balances directly. Separating long and short balances makes it easier to calculate the net figure.
-
Korea Financial Investment Association, Comprehensive Statistics Portal. Link ··· You can track margin loan balances and daily forced-liquidation figures directly here. Useful for checking the falsifiability conditions in this piece.
Past issues worth reading alongside this one
- The Wall Was Already There When You Hit the Brakes ··· This piece examined the structure of systems where the signal arrives already too late. Forced liquidation is exactly the same kind of delayed system.
- The Net That Caught Enron Is Now Empty ··· This piece examined where market surveillance and regulatory design come loose. Worth reading alongside today’s piece.

📝 Glossary
Footnotes
-
Single-stock leveraged ETF: A product designed to track double the daily price movement of a single stock, rather than an index. To maintain the target multiplier, it undergoes mechanical daily rebalancing — buying and selling — and when the fund grows large enough, this rebalancing itself can move the price of the underlying stock. ↩
-
Minimum deposit requirement: The minimum amount that must be deposited in an account before purchasing high-risk products. Raising this threshold reduces the number of participants without banning the product outright. ↩
-
Turnover ratio: The value traded over a given period divided by the product’s asset size. A ratio of 100% means the entire holding changed hands once in a single day — a signal that short-term trading, not holding, is the dominant activity. ↩
-
Forced liquidation (margin call sell-off): When an investor fails to repay borrowed money or settle stocks bought on credit in time, the brokerage sells the collateralized shares without the investor’s consent. Because this generates more selling as prices fall, it amplifies the decline. ↩
-
12-month forward price-to-earnings ratio (P/E): Current stock price divided by projected earnings over the next year. Since the denominator is a forecast rather than confirmed results, the multiple can change even if the stock price stays the same, simply because expectations shift. ↩
Related issues
IBM Is Certifying Thousands of Consultants in OpenAI
OpenAI is expanding enterprise adoption by certifying IBM consultants and client staff with badges of expertise
BusinessThe Costco Cashier Who Turned Down Every Promotion
Meet the $32.90-an-hour Costco cashier who's already a millionaire—and why the company won't let him go.
BusinessMagnificent Seven Mentions Down 70%—Market Weight Unchanged
Bloomberg's coverage of the Magnificent Seven has plunged, yet the group still commands about a third of the S&P 500's value.
Business
Your take shapes the next issue
What resonated most in this issue, or where has your experience been different?