

Morgan Stanley's Three-Stage Map of the AI Cycle
After chips and infrastructure, Morgan Stanley bets software and AI-adopting firms are next — but how we measure that payoff is still crude.
BusinessMorgan Stanley’s Three Boxes of the AI Cycle
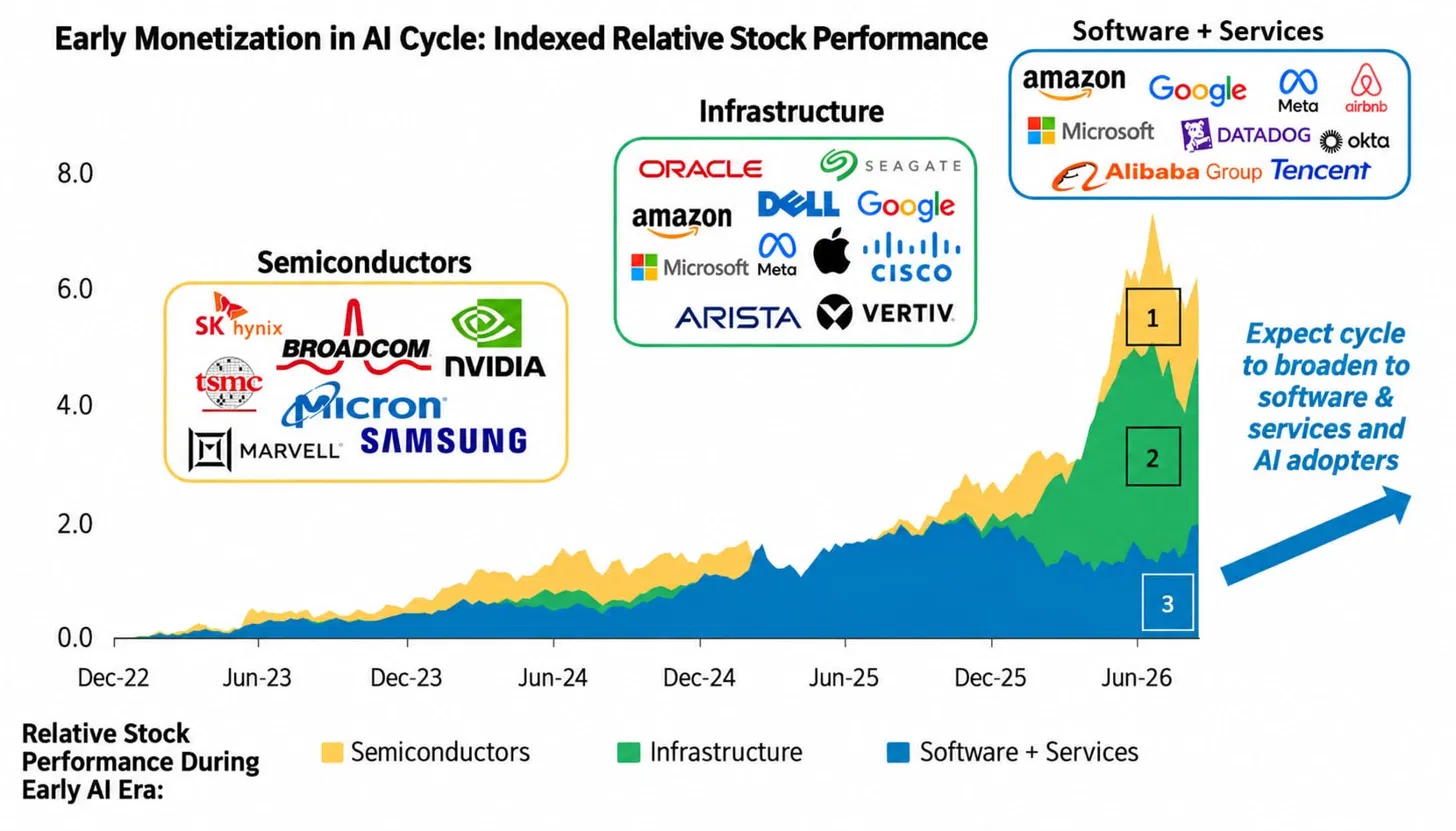
There’s a chart making the rounds from Morgan Stanley’s research. It’s titled “Monetization Early in the AI Cycle,” and it overlays relative stock performance across three groups from December 2022 through the summer of 2026. The semiconductor box holds Nvidia, TSMC, SK Hynix, and Samsung Electronics. The infrastructure box holds Oracle, Dell, Arista, and Vertiv. The software and services box holds Datadog, Okta, and Airbnb. At the far right, an arrow carries a caption saying the cycle will broaden out to software, services, and AI-adopting companies.
The sequence this chart tells matches a report Morgan Stanley Research published in late September. That report projected capex growth among hyperscalers and neoclouds1 decelerating from 93% in 2026 to 61% in 2027 and just 14% in 2028. The implication: a handoff from hardware to software and services could arrive in 2028, and since markets tend to price that in ahead of time, the shift itself would start next year.
The firm framed the next 6 to 12 months as that transition window. The opportunity, in other words, is widening out beyond chips and infrastructure — toward early software vendors and the companies using AI to lift their own productivity and revenue. Even within software, they ranked the order: infrastructure software and cybersecurity first, application software next, and services companies last — benefiting only once their clients turn AI spending into a repeatable return.
Before You Read the Chart
There’s a number that usually comes attached to this chart: the semiconductor-and-infrastructure bundle beat the S&P 500 by 500–700 percentage points. If you overlay all three segments on one graph and read off the gridlines, that’s roughly the figure you get. But there are two things worth keeping in mind alongside it.
The first is the chart format itself. Whether the three colored areas overlap each other or stack on top of one another changes what the same gridline actually means. If it’s a stacked chart, the topmost point represents the sum of all three segments combined — it shouldn’t be read as semiconductors’ performance alone. While writing this issue, I wasn’t able to find the original chart or its footnotes anywhere in the body of the Morgan Stanley report. So for this piece, I’m borrowing the ordering from the chart, not its numbers.
The second is where the boundaries between categories actually fall. Amazon, Google, Microsoft, and Meta sit in both the infrastructure column and the software-and-services column at the same time — they’re companies that build data centers and companies that sell AI on top of them. In fact, back in July, Morgan Stanley described semiconductor weakness as a sign that the market was broadening, writing that investors might rotate toward hyperscalers. The three columns aren’t a relay race passing a baton from one to the next — they’re more like overlapping stretches that move together.
The numbers on the adopter side
So what about the last column — the report card for companies that actually “use” AI? In its February “AI Adoption Rate Map” report, Morgan Stanley compiled figures for companies its analysts classified as AI adopters.
| Category | AI Adopters | MSCI World |
|---|---|---|
| EBIT margin2 expansion, 2024→2025 | +310bp3 | +150bp |
| 2026 expansion (forecast) | +230bp | +130bp |
| 2027 expansion (consensus) | +90bp | +130bp |
In 2025, adopters’ performance was more than double the market average. But look at the table’s last row: the current consensus is that by 2027, adopters’ margin expansion will actually fall short of the market average. Morgan Stanley read this as evidence that the market is underpricing the benefits accruing to adopters.
The numbers kept coming after summer. In late July, Morgan Stanley’s strategy team, led by Michael Wilson, projected that AI adoption would lift net margins by roughly 100bp through 2027. A September report found that companies across multiple sectors had reported average net productivity gains of 9.6% over the preceding year.
How They Counted ‘Measurable Impact’
There’s a point worth pausing on here: how exactly these numbers were counted.
One piece of evidence Morgan Stanley put out in July was that 25% of S&P 500 companies mentioned a measurable AI adoption impact in their Q2 earnings calls. A year earlier, that figure was 14%. The February report’s numbers follow a similar pattern. In Q4 2025, 30% of North American adopter companies cited at least one quantitative AI impact. That’s up sharply from 16% in Q4 2024 — but flip it around, and it also means 70% of companies classified as adopters still haven’t put forward a single number.
The Next Web flagged exactly this. Saying “we saw a measurable impact” on an earnings call costs nothing, and in today’s market, that statement is actually rewarded. Counting companies that mention an impact is a different exercise from counting companies that disclose which task, what baseline, and how much actually changed. The article also points to less encouraging independent evidence: the UK’s Office for National Statistics found that AI adoption is widening but not deepening, and a study published in Harvard Business Review examined how the time saved by AI gets reabsorbed into cleaning up its output.
None of this flips Morgan Stanley’s ordering on its head. But it’s worth keeping in mind that the evidence for moving into that final box still leans more on talk than on measurement.
The infrastructure box isn’t closed yet
Morgan Stanley doesn’t see this shift as a simple handoff either. What its September report emphasized was, if anything, the bottleneck.
The biggest constraint is power. It estimated a shortfall of 57GW between 2026 and 2028 — 30-40% of what’s needed. Since 2025, data center projects worth $286 billion have been delayed or cancelled in the US due to local opposition. So the report concluded that computing demand will significantly outstrip supply for years to come, and that the AI cycle will expand sideways rather than move box by box.
To sum up, here’s the map: the semiconductor and infrastructure boxes are staying open longer than expected because of the bottleneck, the software box is opening first for infrastructure software and security, and the adoption-companies box still has numbers being filled in.
Oswarld's Lens
Lately I’ve been traveling to various regions for advisory, design, and review work on AI data center projects. When I get a review request, there’s something I look at before the site or the GPU count: whether there’s a confirmed tenant4, and whether the lending syndicate is moving on the strength of that tenant’s credit.
I see the same reason Morgan Stanley’s map keeps the infrastructure column open for so long. Chips and buildings move on the numbers written into contracts, but the demand to fill those buildings only materializes once downstream adopters actually spend money and confirm the returns. As long as the effect of adoption stays at the level of “mentioned on the earnings call,” the numbers that go into tenant contracts have to stay just as cautious.
Let me add an experience from the user’s side of the model stack. Work that runs long or is highly repetitive used to go to Luna- or Sonnet-tier models; these days I route it to DeepSeek and GLM. Overall planning, orchestration, and initial design still go to Claude or GPT-6. Even burning trillions of tokens on Ollama Cloud came out overwhelmingly cheaper than Claude or GPT-6, and performance held up well once the harness files were properly configured. What I keep saying is that not everyone, and not every task, needs top-tier frontier-model intelligence.

In the issue last August covering the Fed chair’s remarks on productivity, I wrote that a forecast with no falsification condition isn’t analysis — it’s sales. The same question applies to this map. What number would make us abandon the “moving downstream” thesis? The candidate is already sitting inside Morgan Stanley’s own data. Whether the 2027 consensus of 90bp in margin expansion for adopting companies actually exceeds the market average of 130bp in realized earnings — and whether the number of companies that “disclose” the effect with a baseline, rather than merely “mention” it, actually grows.
Closing
Morgan Stanley’s sequencing itself is convincing. The catch is that the last box is still being filled in first by the earnings-call language, before it shows up on the balance sheet — and by the balance sheet, before it shows up in the stock price. Watching how fast that language turns into baselines and numbers will be a more accurate gauge than watching the arrows on a chart.
This piece is not a recommendation to invest in any specific stock or asset. The forecasts and estimates cited are based on Morgan Stanley research and published reporting.
💬 Has your company ever reported or announced AI’s impact in numbers? Tell me in the comments what you used as the baseline.
📨 If you have a colleague who has to turn AI adoption results into a report, share this piece with them.
Already a subscriber? Sign in to join the conversation


References & Further Reading
Primary sources
- ANI·Asianet Newsable, “Morgan Stanley sees AI investment cycle shift to software by 2028”, 2026.9.28. ··· This is the source for the capex growth forecast, the 57GW power shortfall, the $286 billion in delays and cancellations, the 9.6% net productivity figure, and the shift toward software. Note that this is a news summary, not the original Morgan Stanley report.
- Morgan Stanley Research, “Mapping AI’s Rate of Change: Where the Rubber Meets the Road”, 2026.2.11. ··· The primary data source for the EBIT margin table of adopting companies, the 80% cost-efficiency figure, and the share of firms citing quantifiable gains.
- The Next Web, “A quarter of the S&P now claims measurable AI benefits. Last year it was 14%”, 2026.7.28. ··· Covers the 25% S&P 500 figure alongside criticism of how it was measured.
Background
- Bloomberg Law, “Morgan Stanley Says AI Adopters Set for Solid Profit Margins”, 2026.7.27. ··· Reports on the Wilson strategy team’s forecast of a 100bp net margin improvement.
- The Star(Reuters), “AI investors may pivot to hyperscalers from chipmakers, Morgan Stanley says”, 2026.7.6. ··· A July note reading semiconductor weakness as a signal of broadening market participation.
Related past issues worth reading
- Issue No. 176, “Why Does the New Fed Chair Talk Like a Startup Founder” ··· Looks at how to read forecasts with no falsifiability condition.
- “AI Servers Earn 44%, So Why Does the Cloud Only Make 11%?” ··· An issue that scrutinizes what’s missing from Morgan Stanley’s profitability math on China’s AI infrastructure.

📝 Glossary
Footnotes
-
Hyperscaler / Neocloud: Hyperscalers are cloud companies like Amazon, Microsoft, and Google that build and operate massive data centers themselves. Neoclouds are newer cloud providers that specialize in renting out GPU compute. ↩
-
EBIT margin: The share of revenue that remains as operating profit before interest and taxes. It measures how much a company retains from its core business. ↩
-
bp (basis point): Equal to 0.01 percentage point. So 310bp is 3.1 percentage points, and 100bp is 1 percentage point. ↩
-
Tenant: A customer who leases data center space and power on a long-term basis. The creditworthiness of a committed tenant often becomes the basis for project financing. ↩
Related issues
The Fake Delivery App That Never Delivers Food
Chasing the business model behind 'dopamine sites' leads straight back to a real payment button.
BusinessThe Exchange That Hit No. 1 by Never Asking Questions
Binance founder CZ built an empire by chasing whichever country had the loosest rules.
BusinessTokens Flowed to Open Models, But Money Didn't Follow
In three months, DeepSeek's share jumped from 25% to 64%, but the same gateway's spending chart told the opposite story.
Business
Your take shapes the next issue
What resonated most in this issue, or where has your experience been different?