

Servers Take 2 Months, Foundries Take 4 Years
The further upstream in the supply chain, the later today's decisions are graded.
BusinessA Single Chart with 9 Bars
Reader, on the 3rd, a chart made the rounds on X (formerly Twitter). Posted by the research account P Equity Research citing UBS data, it lines up horizontal bars showing the lead times1 across 9 segments of AI infrastructure, dated as of September 2026.
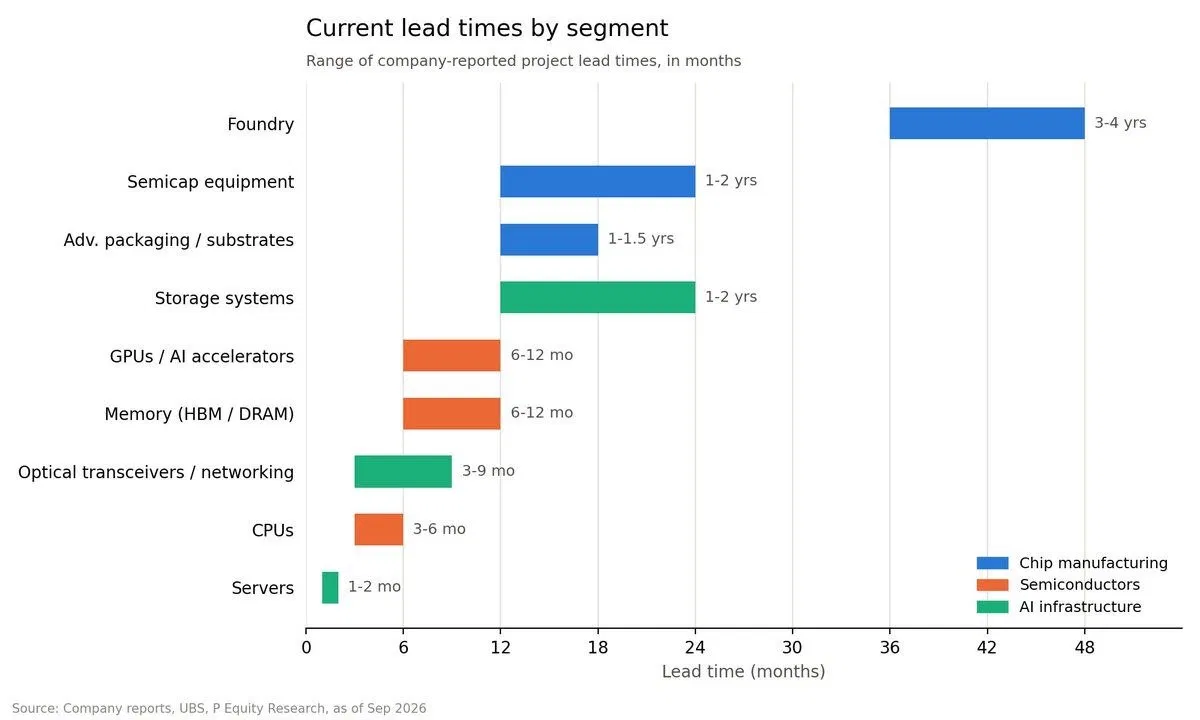
Looking at this chart, your first thought is straightforward: building the fabs to print chips, procuring the equipment inside them, and securing the advanced packaging to tie those chips together takes far longer than assembling finished servers. So without core semiconductors and components to support it, no matter how fast server assembly is, the entire infrastructure buildout gets delayed. That is an accurate reading.
Today, let’s take this a step further. Beyond showing which segments move slowly, this chart also reveals when the decisions behind the hardware in your hands today were actually made.
9 Bars, Different Clocks
First, let’s put the numbers from the chart into a table.
| Segment | Lead Time | Chart Category |
|---|---|---|
| Foundry | 3–4 years | Chip manufacturing |
| Semiconductor manufacturing equipment | 1–2 years | Chip manufacturing |
| Advanced packaging / semiconductor substrates | 1–1.5 years | Chip manufacturing |
| Data storage / systems | 1–2 years | AI infrastructure |
| GPUs / AI accelerators | 6–12 months | Semiconductors |
| Memory (HBM, DRAM) | 6–12 months | Semiconductors |
| Optical transceivers / networking gear | 3–9 months | AI infrastructure |
| CPUs | 3–6 months | Semiconductors |
| Servers | 1–2 months | AI infrastructure |
Looking at the subtitle of the chart, each bar represents the range of project lead times disclosed by companies. But there is 1 caveat here: the bars are not measuring the same thing.
The 1–2 months for servers is close to the time from order to delivery once all components are on hand. On the other hand—though we cannot say definitively because the chart lacks individual definitions—the 3–4 years for foundries is most naturally understood as the time from deciding to build new capacity to actually producing wafers. Comments below the original post made the same point: if chip inventories are sufficient, the time needed to build a new fab has nothing to do with current server lead times; but if chips run short, no amount of assembly speed can fill the void.
That is why this chart is less confusing when read not as 9 delivery schedules, but as 9 separate clocks. Each bar can be seen as answering this question: if this item arrived today, how long ago was the decision made that made its supply possible? For a server, that was last month. For GPUs and HBM3, that was 6 months to 1 year ago; for equipment, 1–2 years ago; and for a fab, 3–4 years ago.
Distinguishing a Long Bar from a Blocked One
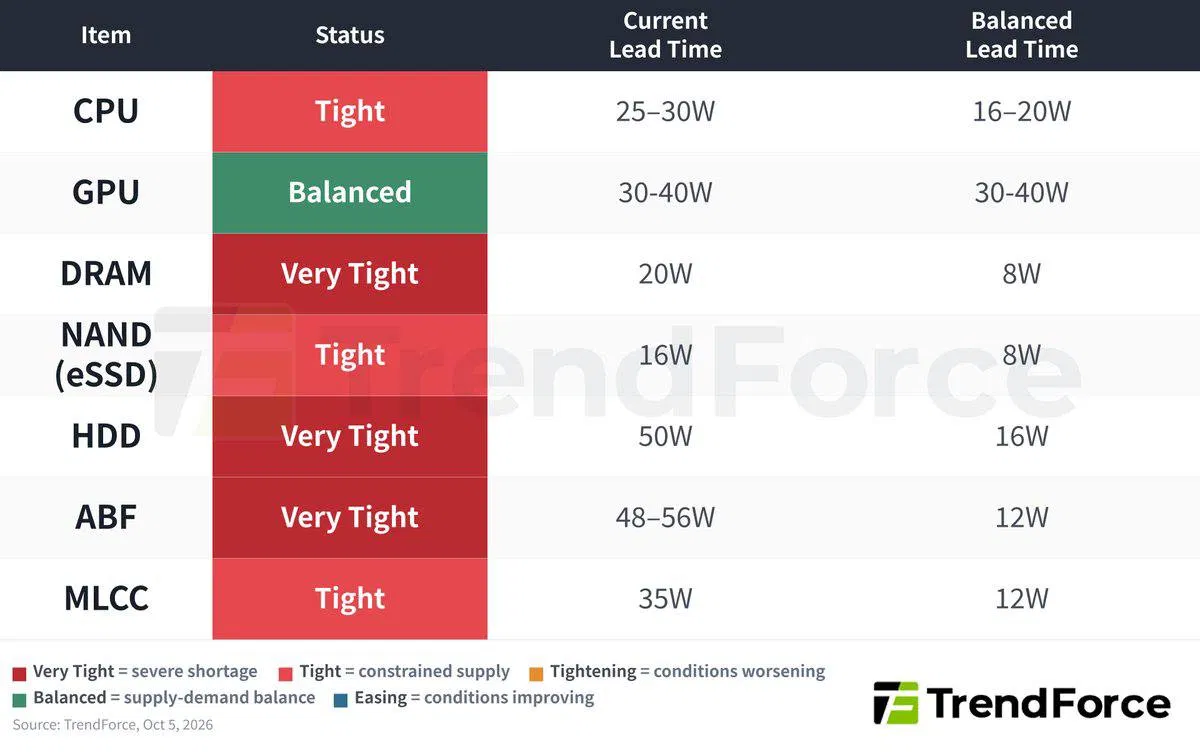
2 days later, on October 5, market intelligence firm TrendForce published a table from a different angle. It placed current lead times for 7 key components side by side with their baseline lead times in a balanced market.
| Component | Status | Current Lead Time | Balanced Market Lead Time |
|---|---|---|---|
| CPU | Tight | 25~30 weeks | 16~20 weeks |
| GPU | Balanced | 30~40 weeks | 30~40 weeks |
| DRAM | Extremely tight | 20 weeks | 8 weeks |
| NAND (Enterprise SSD) | Tight | 16 weeks | 8 weeks |
| HDD | Extremely tight | 50 weeks | 16 weeks |
| ABF Substrates | Extremely tight | 48~56 weeks | 12 weeks |
| MLCC | Tight | 35 weeks | 12 weeks |
While the UBS chart showed the absolute length of the bar, this table reveals how far each bar has stretched beyond normal. Overlaying the 2 yields an unexpected picture. GPUs have a lead time of 30~40 weeks—by no means short—yet their status is marked “Balanced.” In other words, they simply take that long to produce under normal conditions. By contrast, HDDs sit at 50 weeks, more than 3 times their normal 16-week baseline, and ABF substrates4 stretch to 48~56 weeks, over 4 times the standard 12 weeks. MLCCs5—tiny components mounted by the hundreds or thousands across a substrate—stand at 35 weeks, nearly 3 times their norm. DRAM is at 20 weeks, 2.5 times the typical 8 weeks.
The length of the bar tells you how slowly an industry naturally moves; its distance from normal tells you where the system is actually blocked. Going strictly by this table, the most severe blowouts today are not in GPUs—the component everyone talks about—but in the surrounding memory, storage, substrates, and passive components.
Figures vary slightly depending on the source. The UBS chart estimated CPUs at 3~6 months, while TrendForce put them at 25~30 weeks, or roughly 6~7 months. The discrepancy likely stems from differences in measurement criteria and aggregation methodology. This essay cites the 2 datasets separately according to their respective frameworks.
The Fabs of 2029 Are Being Decided Today
TSMC’s first Arizona fab offers a useful yardstick. TSMC announced plans for the facility in May 2020 and broke ground in June 2021. Mass production on its 4nm node began in Q4 2024. That works out to 4.5 years from announcement, or about 3.5 years from groundbreaking—tracking closely with the 3–4 years shown on the chart.
Run that math backward. Subtract 3–4 years from the capacity coming online right now, and you land in 2022–2023. ChatGPT debuted in November 2022, which means the production lines spinning up today were likely decided around the time generative AI demand began taking its current shape.
Run the same math forward, and a far more critical point emerges: Fab expansion decisions made today will be graded by the market of 2029–2030. Memory faces a similar situation. The new fabs Micron is building in Idaho, New York, and Singapore are not expected to yield meaningful volume until mid-2027 at the earliest. In the meantime, Micron is reportedly filling only 50–66% of the DRAM and NAND orders placed by some of its key customers.
The intermediate bars follow the exact same structure. Semiconductor manufacturing equipment takes 1–2 years; advanced packaging6 and substrates take 1–1.5 years. Even if a fab is built, the line does not run if equipment is delayed; even if chips roll off the line, accelerators cannot be completed without the packaging that binds GPU and HBM into a single unit. A short server bar simply means that once every upstream bar is cleared, assembly finishes quickly.
The bars are also intertwined. TrendForce noted that DRAM shortages are spilling over into enterprise SSD constraints. Because DRAM is in short supply, certain NAND makers cannot supply enough enterprise SSDs. Even though NAND lead times have stretched to 2x normal—a milder increase than DRAM’s—finished product supply remains tied up by a single adjacent bar.
There are also bars missing from this chart entirely. Power equipment, which I covered in July in Issue 141, is one. In the data compiled then, transformer lead times ran 24–48 months, and as long as 5 years. Even if you fill every bar on the chip side, if the building and electricity are not ready, the servers stay in the warehouse.
While Waiting in Line, Orders Inflate
Long lead times create another distortion. When upstream suppliers decide whether to expand capacity, the primary signal they look at is incoming orders from downstream buyers. Yet during a shortage, these orders tend to swell far beyond actual need. If you only receive 60% to 70% of what you asked for, you write a bigger number on your next purchase order.
These are the exact numbers circulating in the memory market today. Industry reports suggest that during allocation negotiations for 2027 DRAM and HBM supply, most buyers were allocated only 60% to 70% of their initial requests. To lock in volume, buyers are putting down upfront deposits and committing to 3- to 5-year contracts.
This distortion—where demand signals amplify as they travel upstream through the supply chain—is known as the bullwhip effect7. In Issue 141, I pointed to transformers as an example, but the semiconductor industry has a much more recent precedent.
During the 2021 chip shortage, device makers placed duplicate orders across multiple vendors, fearing they would be left empty-handed. When demand cooled in the second half of 2022, they abruptly halted new orders to burn through their stockpiles. The shock fell hardest on upstream chipmakers. Samsung Electronics saw its Q1 2023 operating profit plunge to ₩600 billion (~$440 million), down by more than 95% from ₩14.12 trillion 1 year earlier. Samsung announced memory production cuts, but across Q1–Q3 2023 alone, its semiconductor division accumulated an operating loss of ₩12.7 trillion, while SK Hynix lost ₩8.1 trillion. It took less than 2 years for the shortage that began in early 2021 to flip into a glut by late 2022.
Players with shorter lead times can react relatively quickly to such reversals. A server vendor can simply cut next month’s order. A fab that has already committed to a 3- to 4-year buildout cannot. The fab finishes construction, depreciation begins, and to keep utilization rates up, it must sell—even if that means slashing prices.
Looking at the Same Numbers and Reaching Opposite Conclusions
That is why two diametrically opposed scenarios are currently circulating in the memory market.
On one side is SK hynix CEO Kwak Noh-jung. In a Reuters interview on July 10, he predicted that 2027 would be the most difficult year in industry history from a supply standpoint, and that customer demand would outstrip the company’s production capacity well beyond 2030. Hard numbers back up his stance. HBM volume is reportedly sold out through 2027, with hyperscalers committing $22 billion in advance deposits to secure supply. TrendForce reports that DRAM contract prices in the 3rd quarter of this year rose 15~18% from the previous quarter.
Micron took the same stance in its recent earnings release. After posting a record quarterly revenue of $54.2 billion, the company noted that there was no visible end to the supply-demand imbalance. More than 75% of its 2027 production is already committed, and strategic customer contracts—some extending through 2031—have expanded to 26 agreements.
On the other side is Bloomberg’s Shuli Ren. Relying on supply-demand balance modeling, Ren argues that shortages peaked in the 2nd quarter of 2026, will stabilize around the 4th quarter of 2027, and could swing into a glut by 2028. The reasoning is that the massive capital expenditures poured in by the 3 memory makers will all come online around the same time.
These two scenarios illustrate two sides of long lead times. In a phase of expanding demand, segments with longer supply response times gain greater pricing power and order visibility. Customers put down advance payments and book years in advance precisely because the waiting time is so long. Conversely, if demand growth has slowed by the time capacity expansion finishes after that long stretch, that exact same delay boomerangs as oversupply and plunging utilization rates.
There is one caveat worth attaching to supplier forecasts: the longer shortages persist, the more suppliers profit. That does not mean their forecast is wrong. It simply means we should also look at who benefits from whose forecast.
Long-term contracts are a mechanism for shifting risk between these two realities. As seen in SanDisk’s 4-year contract discussed in Issue 183, when customers commit advance deposits and penalty clauses, part of the loss from misjudging the timing shifts from the supplier to the buyer. Viewed this way, having bargaining power also means possessing the ability to offload the risk of timing miscalculations onto your counterparty.
Oswarld’s Lens
Lately, I have been traveling across regions advising on, designing, and evaluating AI data center projects. Whenever a review request lands on my desk, there is something I check before looking at lot sizes or GPU counts: whether there is a confirmed tenant in place, and whether the lending syndicate is willing to move on the strength of that tenant’s credit.
There is another detail I watch closely when reviewing contracts. Looking at service terms with CDN operators or telecom carriers, CPU-based agreements almost always assume hardware remains unchanged throughout the operating period. By contrast, 5- to 6-year contracts with neoclouds8 frequently include a standard clause stating that any hardware generation change requires mutual agreement.

This also explains why I look at tenants first. The longer the decision horizon, the less reliable current order volume becomes as a signal. Quantities can easily inflate while buyers wait in line. Whether someone has put real money and credit behind that order is the only signal that will still hold true years later when construction wraps up.
This article analyzes supply chain mechanics. It is not an investment recommendation for any specific stock, and the forecasts cited are used solely to illustrate how the market views this industry.
Closing
The next time you hear that server lead times have shrunk to 2 months, remember to consider the state of the bars stacked above it. Even if the bottom bar is short, if the bars at the top remain long, today’s optimism and pessimism will take years to grade. The point where the outlooks of SK hynix CEO Kwak Noh-jung and Shuli Ren diverge lies between late 2027 and 2028.
💬 When your company procured AI servers or GPUs, what actually took the longest to arrive? Was it the servers themselves, or bottlenecks elsewhere like power and networking? Let us know in the comments.
📨 If you have colleagues handling infrastructure procurement or keeping a close eye on the semiconductor industry, please share this issue with them.
Already a subscriber? Sign in to join the conversation


References & Further Reading
Primary sources
- P Equity Research, UBS lead time chart post, X, October 3, 2026. ··· The charts and segment-by-segment lead times in this article are based on this post’s chart (source cited: Company reports, UBS, P Equity Research, as of September 2026).
- TrendForce, Weekly Radar 004: DRAM Tightness Is Becoming an Enterprise SSD Constraint, October 5, 2026. ··· Table of current vs. balanced lead times across 7 components, DRAM shortages spilling into enterprise SSDs, and Micron’s earnings and supply outlook.
- TrendForce, Toshiba to Double AI Data Center HDD Capacity by FY2027, October 2, 2026. ··· Toshiba’s expansion plans citing Nikkei reports.
- Traders Agency, Toshiba Plans to Double AI Data Center HDD Capacity by Fiscal 2027, October 2026. ··· Same-day share price drops for Seagate and Western Digital, alongside reported supply commitments from the 2 companies.
- Taiwan News, TSMC starts construction on Arizona chip plant, June 1, 2021. ··· Groundbreaking date for the Arizona fab.
- Arizona Technology Council, TSMC computer chip fourth quarter results, January 2025. ··· Commencement of mass production in Q4 2024.
- GadgetReview, 2027 Could Be Memory’s Worst Supply Year Yet, SK Hynix CEO Warns, August 17, 2026. ··· SK hynix CEO Kwak Noh-jung’s Reuters interview, Shuli Ren’s analysis, and Micron supply figures.
- Hostzealot, Samsung, SK hynix, and Micron Max Out DRAM and HBM Orders Up to 2027, August 5, 2026. ··· 3–5-year contracts and prepayment practices citing DigiTimes.
- Sammyfans, AI demand reportedly books nearly all 2027 DRAM and HBM supply, August 3, 2026. ··· Reports of allocations limited to 60–70% of requested volumes.
- Mezha, SK Hynix CEO: 2027 will be the ‘worst’ year, July 12, 2026. ··· TrendForce’s Q3 DRAM contract price growth rates.
- Fusion Worldwide, Where are we in the inventory digestion cycle. ··· Double-ordering and inventory digestion between 2021 and 2023.
- CNBC, How the world went from a semiconductor shortage to a major glut, July 28, 2023. ··· The transition from shortage to glut and the bullwhip effect.
- Fierce Electronics, PC shipments drop 29%, Samsung profits plunge 96%, April 2023. ··· Samsung Electronics’ Q1 2023 preliminary earnings and production cut announcement.
- Korea JoongAng Daily, Samsung, SK hynix suffer $16 billion loss in chip business, December 26, 2023. ··· Semiconductor division operating losses across Q1–Q3 2023.
Further reading
- Issue 141 · Data Centers Aren’t Stalling Over Money or Chips
- Issue 183 · The 4-Year Commitment SanDisk Secured

📝 Glossary
Footnotes
-
Lead time: The duration between placing an order or making a decision and actually receiving physical product or active production capacity. ↩
-
Foundry: A contract semiconductor manufacturer or fabrication facility that produces chips designed by other companies, exemplified by TSMC. ↩
-
HBM (High Bandwidth Memory): Memory built by vertically stacking multiple DRAM dies to deliver high-throughput data transfers, positioned directly alongside AI accelerators. ↩
-
ABF substrate: A high-performance packaging substrate that uses Ajinomoto Build-up Film insulation, serving as the structural and electrical bridge connecting CPUs and GPUs to motherboards. ↩
-
MLCC (Multi-Layer Ceramic Capacitor): A compact passive component that temporarily stores and releases electrical charge to stabilize current, deployed in large quantities even on a single server board. ↩
-
Advanced packaging: The manufacturing process of integrating and interconnecting multiple distinct semiconductor dies into a single unit, exemplified by TSMC’s CoWoS, which mounts GPUs alongside HBM on a shared substrate. ↩
-
Bullwhip effect: A supply chain dynamic where minor fluctuations in end-customer demand amplify into increasingly large order distortions the further upstream they travel. ↩
-
Neocloud: Specialized, fast-growing cloud infrastructure providers focused specifically on renting out GPU compute capacity, distinct from the 3 major cloud hyperscalers. ↩
Related issues
Korea's Mobile Plan Overhaul Came in 5 Waves, Not 1
Persistent search spikes reveal why consumers are still struggling to decode what actually changed months after the official rollout.
BusinessFour Months on Leave, and the AI Models Changed
The share of women in AI roles drops sharply as compensation tiers climb, LinkedIn data reveals.
BusinessOpenAI's $20 Billion Gap: A Counting Trick, Not a Loss
Thursday's panic over a missing $20 billion in OpenAI revenue was really a clash between gross and net accounting.
Business
Your take shapes the next issue
What resonated most in this issue, or where has your experience been different?