

Same 400,000 Wafers, Two Growth Rates: 25% vs. 10%
Applied Materials counts 25% DRAM capacity growth this year; Korean brokerages count 10%—same wafers, different denominators.
BusinessThe DRAM Capacity Numbers Released Yesterday Aren’t Forecasts—They’re a Construction Schedule
Applied Materials CFO Brice Hill put out DRAM capacity numbers at Citi’s Global TMT Conference on September 8, 2026. A year earlier, the industry’s total wafer starts1 stood at around 1.6 million wafers a month; this year the industry is adding 400,000 wafers a month on top of that, and for the next few years it’ll keep adding another 300,000-400,000 wafers a month, every year.
There’s a reason this number carries different weight than other forecasts. Applied Materials doesn’t buy DRAM—it puts the equipment inside DRAM fabs. Hill said his company’s fab tracker follows more than 100 facilities, that leading-edge logic and DRAM lines are running at close to 100% utilization, and that the bottleneck on expansion right now isn’t demand but the pace of cleanroom construction. He also gave the unit economics: building 100,000 wafers a month of capacity in a greenfield fab2 takes roughly $10 billion in equipment alone, while upgrading an existing line costs about a quarter of that. That’s also where the estimate of needing 15-17 new fabs by 2030 comes from.
So the 400,000-wafer figure isn’t a guess about who will buy how much—it’s a statement about equipment that’s already been ordered and ground that’s already being broken. Divide 400,000 by 1.6 million and you get 25%, which is where the line now circulating in the market—“DRAM capacity is up 25% this year”—comes from.
Yet for the same year, the model used by Korean brokerages puts the number at 10%.
25% and 10% Are Counting Almost the Same Wafers
A report Mirae Asset Securities put out on March 23, 2026 pegs new DRAM wafer capacity for 2026 and 2027 at 197,000 and 282,000 wafers, respectively. It puts Samsung Electronics at 80,000-100,000 wafers, counting both its Pyeongtaek (a city in South Korea) P4 and P5 lines, and SK hynix at 65,000-80,000 wafers once its Yongin, South Korea Y1 fab comes online in 2027. The report labels these increments +10.3% and +13.5%.
Let’s back out the denominator. If 197,000 wafers equals 10.3%, the baseline capacity works out to about 1.91 million wafers. The second figure—282,000 wafers as 13.5%—points to nearly the same baseline. Applied Materials’ baseline, remember, was 1.6 million. The two numbers don’t diverge over how many wafers get added—they diverge over how many wafers are already being counted as existing. The endpoints land at 2 million and 2.11 million, a gap of about 110,000 wafers, but the starting points—1.6 million versus 1.91 million—are 310,000 wafers apart.
What exactly makes up that 310,000-wafer gap can’t be pinned down from public data alone. There are three candidate explanations. First, the reference dates differ: Applied Materials said “a year earlier,” meaning the second half of 2025, while the Korean report is likely benchmarked to year-end 2025. Second, the roster of companies counted differs—whether you count only the top three players or also CXMT and Taiwan’s smaller makers swings the total by hundreds of thousands of wafers. Third, the two may differ on whether capacity lost to process-node transitions has already been subtracted from the total.
Either way, the reading is the same. 25% doesn’t mean the industry is growing by 25%—it’s a ratio that depends on how many fabs the speaker is willing to count as already existing. Arguing over which of the two numbers is “correct” gets you very little, because they’re counting different things.
 Not every added wafer turns into bits
Once you’ve sorted out the denominator, one question remains: what does that wafer actually turn into?
HBM dies are larger than ordinary DRAM dies and much harder to yield, so getting the same number of bits out requires 2–3 times as many wafers. Micron itself has publicly stated that ramping HBM output involves a roughly 3-to-1 wafer conversion. On top of that, the shift to 10nm-class 5th- and 6th-generation nodes itself reduces the number of chips per wafer. So a substantial share of every new wafer that Samsung Electronics, SK hynix, and Micron add effectively evaporates once converted into bits.
The other side of the ledger looks different. CXMT’s revenue comes almost entirely from commodity DDR and LPDDR. With virtually no HBM exposure, its wafers convert almost directly into commodity bits. In data released by Counterpoint Research on September 1, 2026, CXMT’s share of global DRAM revenue climbed to 10% in Q2 2026, up from 4% a year earlier and 8% the previous quarter. Over the same period, SK hynix’s share fell from 39% to 25%.
That said, this is a revenue share, not a bit share. In a quarter when commodity prices spiked, the figure can look larger than actual shipment volumes would suggest. By SemiAnalysis’s estimate, CXMT’s cost per bit for DDR5 runs more than 30% higher than the top three players’. That also makes it the first to get hurt whenever prices fall.
What Happened in 2019 Wasn’t a Chicken Game
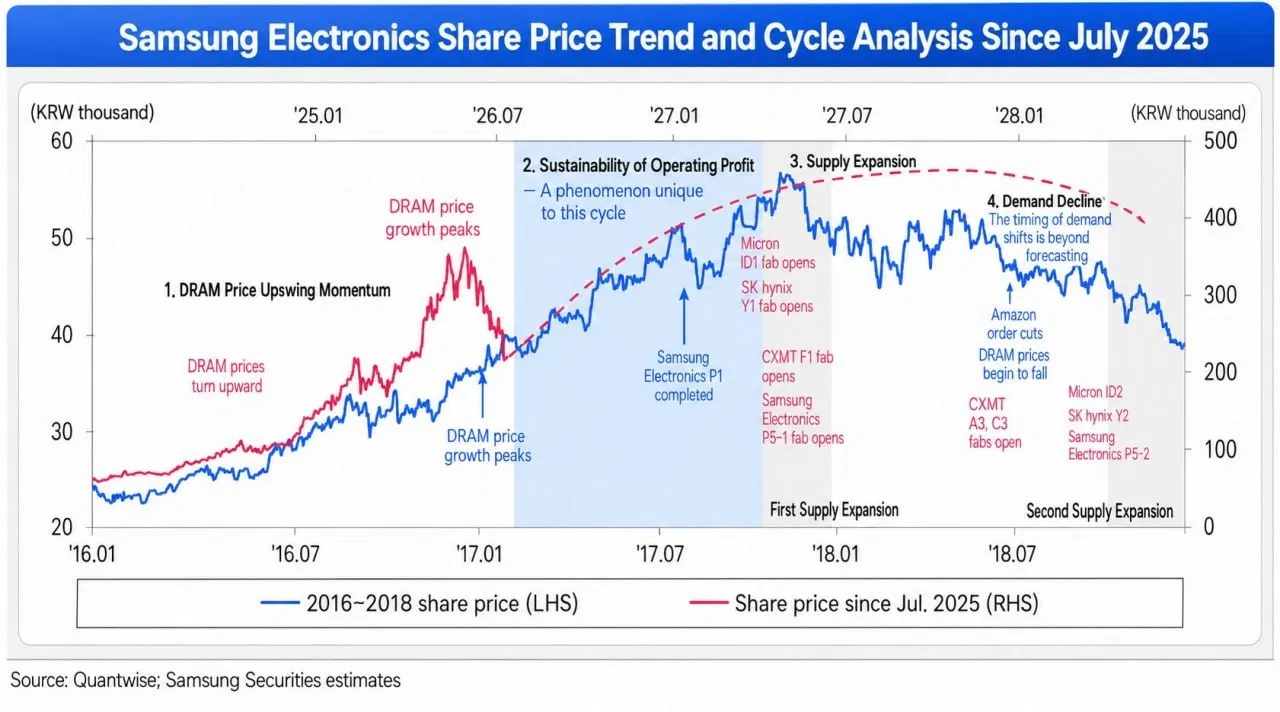
The Samsung Securities chart making the rounds overlays the 2016–2018 cycle onto the period after July 2025, placing the supply-expansion and demand-slowdown phases roughly a year apart. The term “chicken game” attaches itself naturally here, but the two events run on different mechanics.
What followed 2016–2018 was an inventory correction. Samsung Electronics’ semiconductor division operating profit fell 68.5%, from ₩44.57 trillion (~$32.4B) in 2018 to ₩14.02 trillion (~$10.2B) in 2019, but all three companies cut investment in the same direction, and the recovery came about six quarters later. The real chicken game was 2008–2009 — a contest of selling below cost, where the side that outlasted the other won. By the end of it, Qimonda collapsed in January 2009, and Elpida went bankrupt in February 2012. For this kind of game to exist at all, there has to be a participant willing to keep producing while absorbing losses.
The three incumbents aren’t the ones who could sit in that seat today. And we’ve already seen a preview once. In Q4 2024, Samsung Electronics’ DS division posted operating profit of just ₩2.9 trillion (~$2.1B), and one of the reasons the company and the industry cited at the time was falling commodity memory prices driven by a wave of low-cost supply out of China. In other words, the same thing already happened once — before AI demand papered over it.
The problem is that most of Samsung Electronics’ and SK hynix’s profits today come from exactly that commodity DRAM. In Q1 2026, the two companies’ combined operating profit came to roughly ₩95 trillion (~$69.1B), and according to Seoul Economic Daily, the ₩15 trillion (~$10.9B) gap between their memory profits wasn’t driven by HBM — it was driven by commodity DRAM, whose prices had risen more than 100%. At Pyeongtaek P4, too, roughly 40% of targeted output is earmarked for commodity DRAM.
Three Questions to Ask Before Trusting Any Supply Number
You’re going to keep running into sentences like “supply is rising X%.” We’ve already covered whether that’s wafers or bits, and what’s sitting in the denominator. There’s just one more question worth adding: which product is that wafer actually going into.
| Question | What to check | Why it matters |
|---|---|---|
| Wafers or bits? | Input basis or shipped-bit basis | HBM conversion and node shrinks pull wafers and bits apart |
| What’s the denominator? | Baseline period, whether China is included, whether conversion losses are factored in | The same wafer count can read as 25% or 10% |
| Which product does it feed? | Leading-edge DRAM/HBM or commodity DRAM | Oversupply hits at the product-category level, not the industry level |
The metrics worth tracking follow from this: whether commodity DDR5 contract prices and HBM selling prices are moving in the same direction, whether China’s commodity bit shipments are being absorbed domestically or pushed out as exports, and which way the commodity share is shifting in the product mix at Samsung Electronics and SK Hynix.
Some players are facing decisions right now. Memory supply contracts have recently shifted from roughly a 1-year term to 3–5 years, with 10–30% upfront deposits and legally binding clauses carrying damages provisions3. These are contracts that lock in shortage-era pricing over a long horizon. In a scenario where commodity DRAM turns down first, that contract stops being a hedge and becomes a liability. Before signing anything now, it’s worth first separating out whether the contract’s pricing benchmark is commodity DRAM or HBM.
 Oswarld’s Lens
The first calculation I made when I got this data was also 400,000 divided by 1,600,000. 25%. And the sentence “chicken game in a year” followed naturally. But it wasn’t until I saw a model calling the same year “10%” that I realized what I’d divided wasn’t the industry — it was someone’s counting standard.
When a number travels, the ratio tends to tag along fine, but the denominator often doesn’t. So by the time “25%” arrives in the meeting room, what exactly was being called “1.6 million units” has already vanished.
Looking at the chart again, there’s an interesting detail. Samsung Securities has already placed CXMT’s F1, A3, and C3 fabs in the supply-expansion segment. It’s not that they left China out — they lined up China’s fabs on the same row as Micron’s ID2, SK Hynix’s Y2, and Samsung Electronics’ P5-2. In my judgment, that’s exactly where things go off track. They’re on the same row, but those fabs make different products, and the companies behind them react to price signals in different ways. The reason a producer with 30% higher costs keeps churning out output anyway isn’t margin — it’s self-sufficiency.
That’s why I look at product category before timing. The segment the chart points to is leading-edge DRAM and HBM lines — but the place generating the most profit right now, and the only place where China is coming in head-on, is commodity DRAM.
Closing
To sum up: Applied’s 25% and the domestic model’s 10% are largely the same scale of capacity expansion divided by different denominators. So what this debate actually needs to settle isn’t the size of the expansion — it’s which product those wafers end up in, and who sets the price for that product.
Let me flag the limitations too. Applied Materials sells equipment, so it has an incentive to frame capacity expansion as large. The Mirae Asset report is from March, so it doesn’t reflect six months of subsequent orders. Samsung Electronics stated on its July 30, 2026 conference call that the supply shortage in 2027 would be worse than this year’s and would continue into 2028. The Financial Times, in a July 19 report, flagged the possibility of oversupply in 2028–2029. The fact that analysts looking at the same data can arrive at conclusions this far apart is itself a signal that right now, the priority is getting the denominators straight.
Reader, I’d bet that at least one of the three questions we laid out today doesn’t have an answer in whatever data you currently have on hand.
💬 If you’re currently negotiating or reviewing a memory or server procurement contract, tell me in the comments how many years it runs and whether the pricing benchmark is commodity DRAM or HBM. I’m curious what terms are actually being discussed out there.
📨 If you have a colleague budgeting for server or PC procurement costs for 2027, feel free to forward this letter to them as-is.
Already a subscriber? Sign in to join the conversation


References & Further Reading
Primary sources
- Investing.com, “Applied Materials at Citi conference: AI demand keeps outlook strong”, September 8, 2026. ··· The transcript includes CFO Hill’s remarks verbatim, so you can check the context around the 1.6 million, 400,000, and 300,000-400,000 wafer figures directly.
- Mirae Asset Securities, “Semiconductors: Concerns Over Memory Price Peak-Out Are Premature”, March 23, 2026. ··· This is the primary source for the 2026-2027 new wafer capacity figures of 197,000 and 282,000 units and growth rates of 10.3% and 13.5%.
- Digital Daily, “‘Extreme-level’ DRAM expansion being fast-tracked by Samsung and SK”, May 12, 2026. ··· Explains both HBM’s 2-3x wafer requirement and the capacity reduction from migrating to finer process nodes.
- Seoul Economic Daily, “₩15 trillion (~$10.8B) profit gap between Samsung and SK Hynix in memory—commodity DRAM was the deciding factor”, April 26, 2026. ··· Shows which products are driving profits right now and how large the commodity share is at P4.
Background
- Tech Times, “CXMT Hits 10% DRAM Market Share”, September 3, 2026. ··· Covers both Counterpoint’s market-share data and the cost disadvantage of DUV-based production.
- Dailian, “Samsung Electronics posts ₩27 trillion (~$19.4B) operating profit last year”, January 30, 2020. ··· A primary-source record of the semiconductor division’s decline from ₩44.57 trillion (~$32B) in 2018 to ₩14.02 trillion (~$10.1B) in 2019.
- SBS Biz, “Samsung Electronics’ chip division didn’t even clear ₩3 trillion (~$2.2B) in Q4 last year”, January 31, 2025. ··· A record of Q4 2024, when a wave of cheap Chinese supply pushed commodity memory prices down.
- Newsis, “Memory that’s selling out—already worried about oversupply?”, July 20, 2026. ··· Summarizes a Financial Times report raising the possibility of oversupply in 2028-2029.
Related past issues
- The Day It Crashed, China Wanted More Nvidia Chips
- The Four-Year Pledge SanDisk Extracted
- Memory Is the Next Battlefield for AI Chips

📝 Glossary
Footnotes
-
Wafer starts: The number of wafers a fab feeds into its production line per month (WSPM). It’s an input measure of capacity—how many chips and bits actually come out varies enormously depending on process generation and product mix. ↩
-
Greenfield fab: A brand-new factory built on empty land. Unlike upgrading an existing line, it requires building everything from the clean room and utilities up, which makes equipment investment roughly 4x larger, and typically takes 2-3 years from groundbreaking to mass production. ↩
-
Long-term supply agreement (LTA): A contract locking in volume and price over a fixed period in advance. In the recent memory market, these have grown longer—3-5 years—and increasingly include upfront payments and damages clauses. ↩
Related issues
Everyone Talks AI Safety, But Sends the Bill Elsewhere
Both the 'slow down' camp and the 'just race' camp use the same word—the real split is who foots the bill.
BusinessSmart Glasses Cameras Went Dark. AI Went to the Factory
Camera and computer-vision tech kept advancing, but social acceptance didn't — so intelligence moved to the factory instead.
BusinessClick 'Delivery Accident,' Get a Refund Policy Instead
I compared Korea's official rider guidance against the actual law, line by line, on where injured workers should actually file a claim.
Business
Your take shapes the next issue
What resonated most in this issue, or where has your experience been different?